With the growing prevalence of analytics in the NFL and the playoffs right around the corner, it’s more important than ever for teams to give themselves every statistical edge possible to win games. Offensive play calling and game management have noticeably changed in the era of analytics, but an area of the game that is still relatively immature with analytics is Special Teams. Using NFL data from the 2018-2020 seasons, we can begin to think about how to manage Special Teams in order to maximize yardage both on the punting and returning sides of the ball.
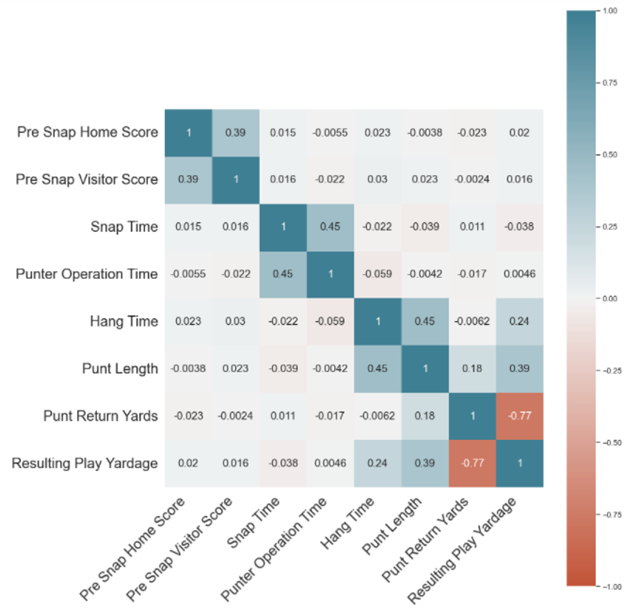
Let’s begin with the chart below that shows the correlation of several numeric variables within the punt game. The resulting play yardage is the key variable that teams want to focus on. This is the net distance between the yard line the punting team began on and the yard line the returning team finishes the play on. No surprise here as punt length and hang time are the two most correlated variables that the punting team can control. Snap time and the time it takes for the punter to handle the football are both statistically insignificant since there is little variation for these metrics across the league. However, it’s intuitive that a quicker snap would lead to a better punt due to more time for the punter, and a rushed punter operation could also lead to a worse punt.
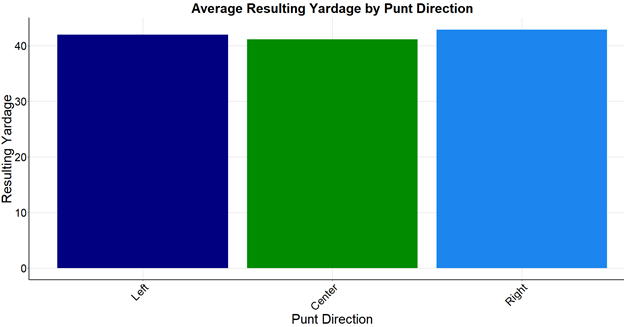
While the above correlation matrix doesn’t particularly teach us anything that teams don’t already know, the below visuals could potentially offer punters and coaches a usable strategy. On average, punts to the left result in an extra one net yard per play for the punting team compared to center, and punts to the right result in an extra two yards per play compared to center. We can dive deeper into net yardage by looking at return direction as well. The table following the below graph shows the net yardage by punt direction and return direction, with a proceeding visual to demonstrate the results.
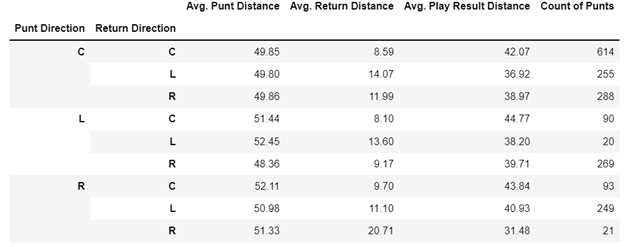
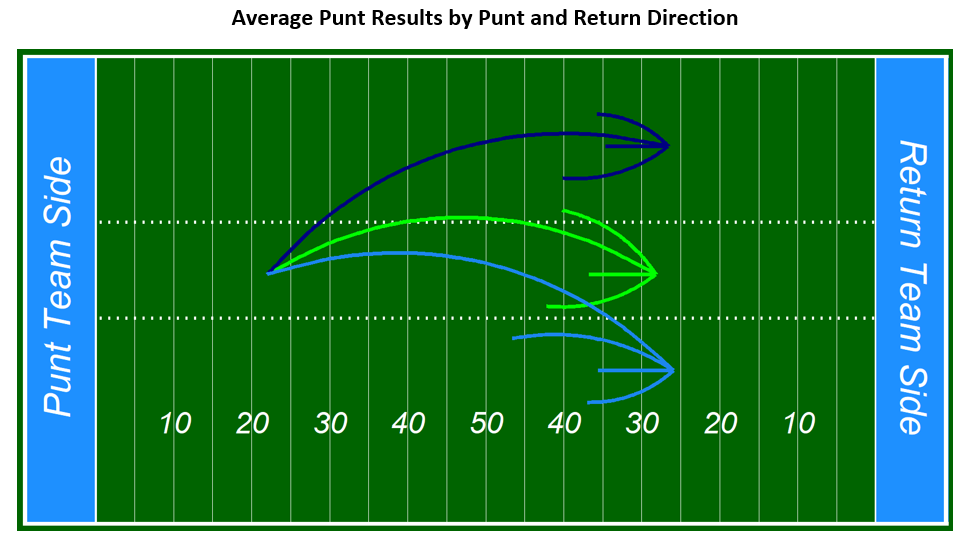
The general idea from the above diagram shows that the optimal punt strategy is to punt towards a sideline and force the returner center or to the side. This strategy runs the risk of punting out of bounds and losing yardage, but due to the top talent of NFL punters, this strategy still gives the best results on average. However, if you punt to the sideline and allow the returner to get towards the middle, you are now at a greater disadvantage than if you just punted center.
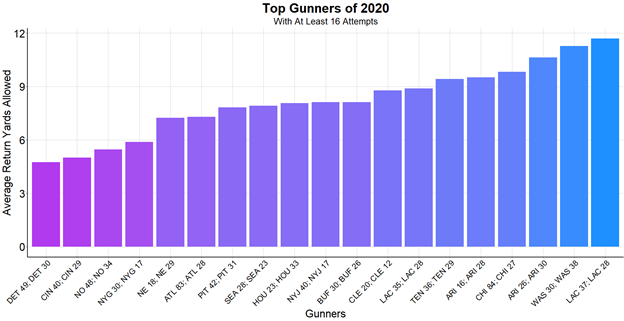
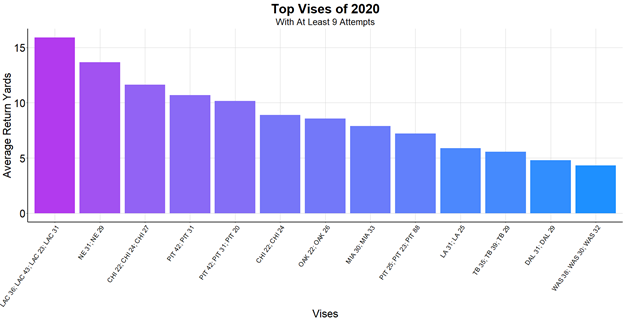
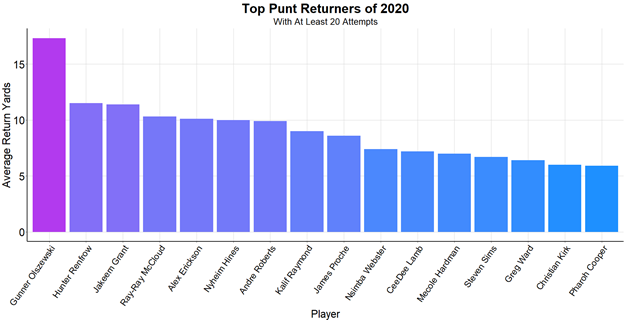
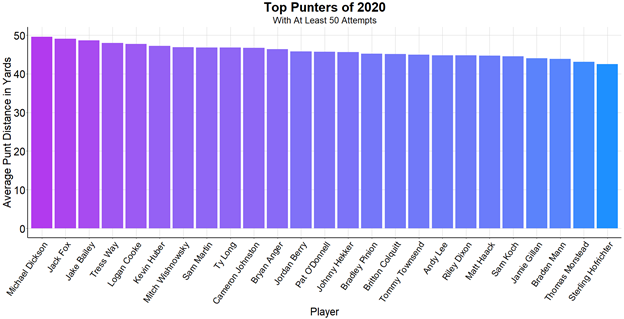
When it comes to Special Teams personnel, it’s often thought of that the punters and the returners are the two most important players on the field. As the below four charts show, the gunners (punt team players who specialize in running down the returner) and the vises (the return team players who attempt to prevent the gunners from running down the returner) play a much larger role. Note that the variation in return yards among the top gunners and vises ranges from an average of about 10 yards per punt. Meanwhile, the variation in return and punt yards among the top returners and punters is just about 5 yards per punt. With returners, there are occasionally outlying superstars, such as Devin Hester or in 2020, Gunner Olscewski, but the difference between top tier and bottom tier NFL punters is much more insignificant.
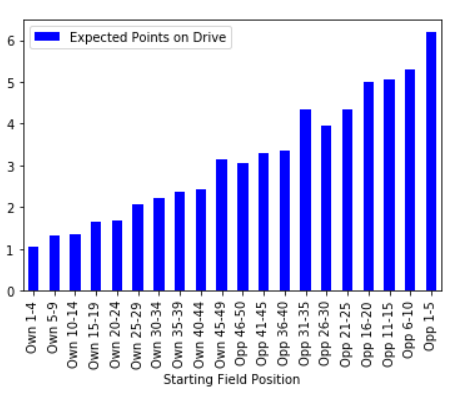
If teams can optimize punt strategy and player personnel, significantly better results can be achieved. The chart below shows the expected points per drive depending on where a drive begins. Every 5 yards corresponds to about 0.25 less expected points per drive. In a game where a team punts four times, five additional yards per punt can save the team a full expected point on defense. While Special Teams and punting is just one of many aspects of a football game, taking these statically optimal steps can be the difference between winning and losing a close game.