The MLB playoffs began last week with 3 out of 4 underdogs winning their wildcard series. And just a year ago, the World Series featured a 5 seeded Texas Rangers beating a 6 seeded Arizona Diamondbacks. October chaos is nothing new. Since the MLB expanded playoffs to 8 teams in 1995 (currently 12 teams make it), the higher seed only wins the series 54% of the time.
Hockey fans are also used to watching an unpredictable playoffs. Since 2012, we’ve seen NHL teams finish the regular season conference standings in 8th, 6th, and 5th all win the Stanley Cup (Kings 2012, 2014, Blues 2019).
While basketball seems more predictable, even the 2023 NBA finals featured an 8 seeded Miami Heat. And the 2021 WNBA finals were won by the 6th seeded Chicago Sky.
In addition to baseball, hockey, and basketball, we will explore other major U.S. and Canada professional sports league playoffs to get a sense of the unpredictable nature of each. Seeds and regular season standings don’t always define which team is the ‘favorite’, but for simplicity that will be our baseline metric.
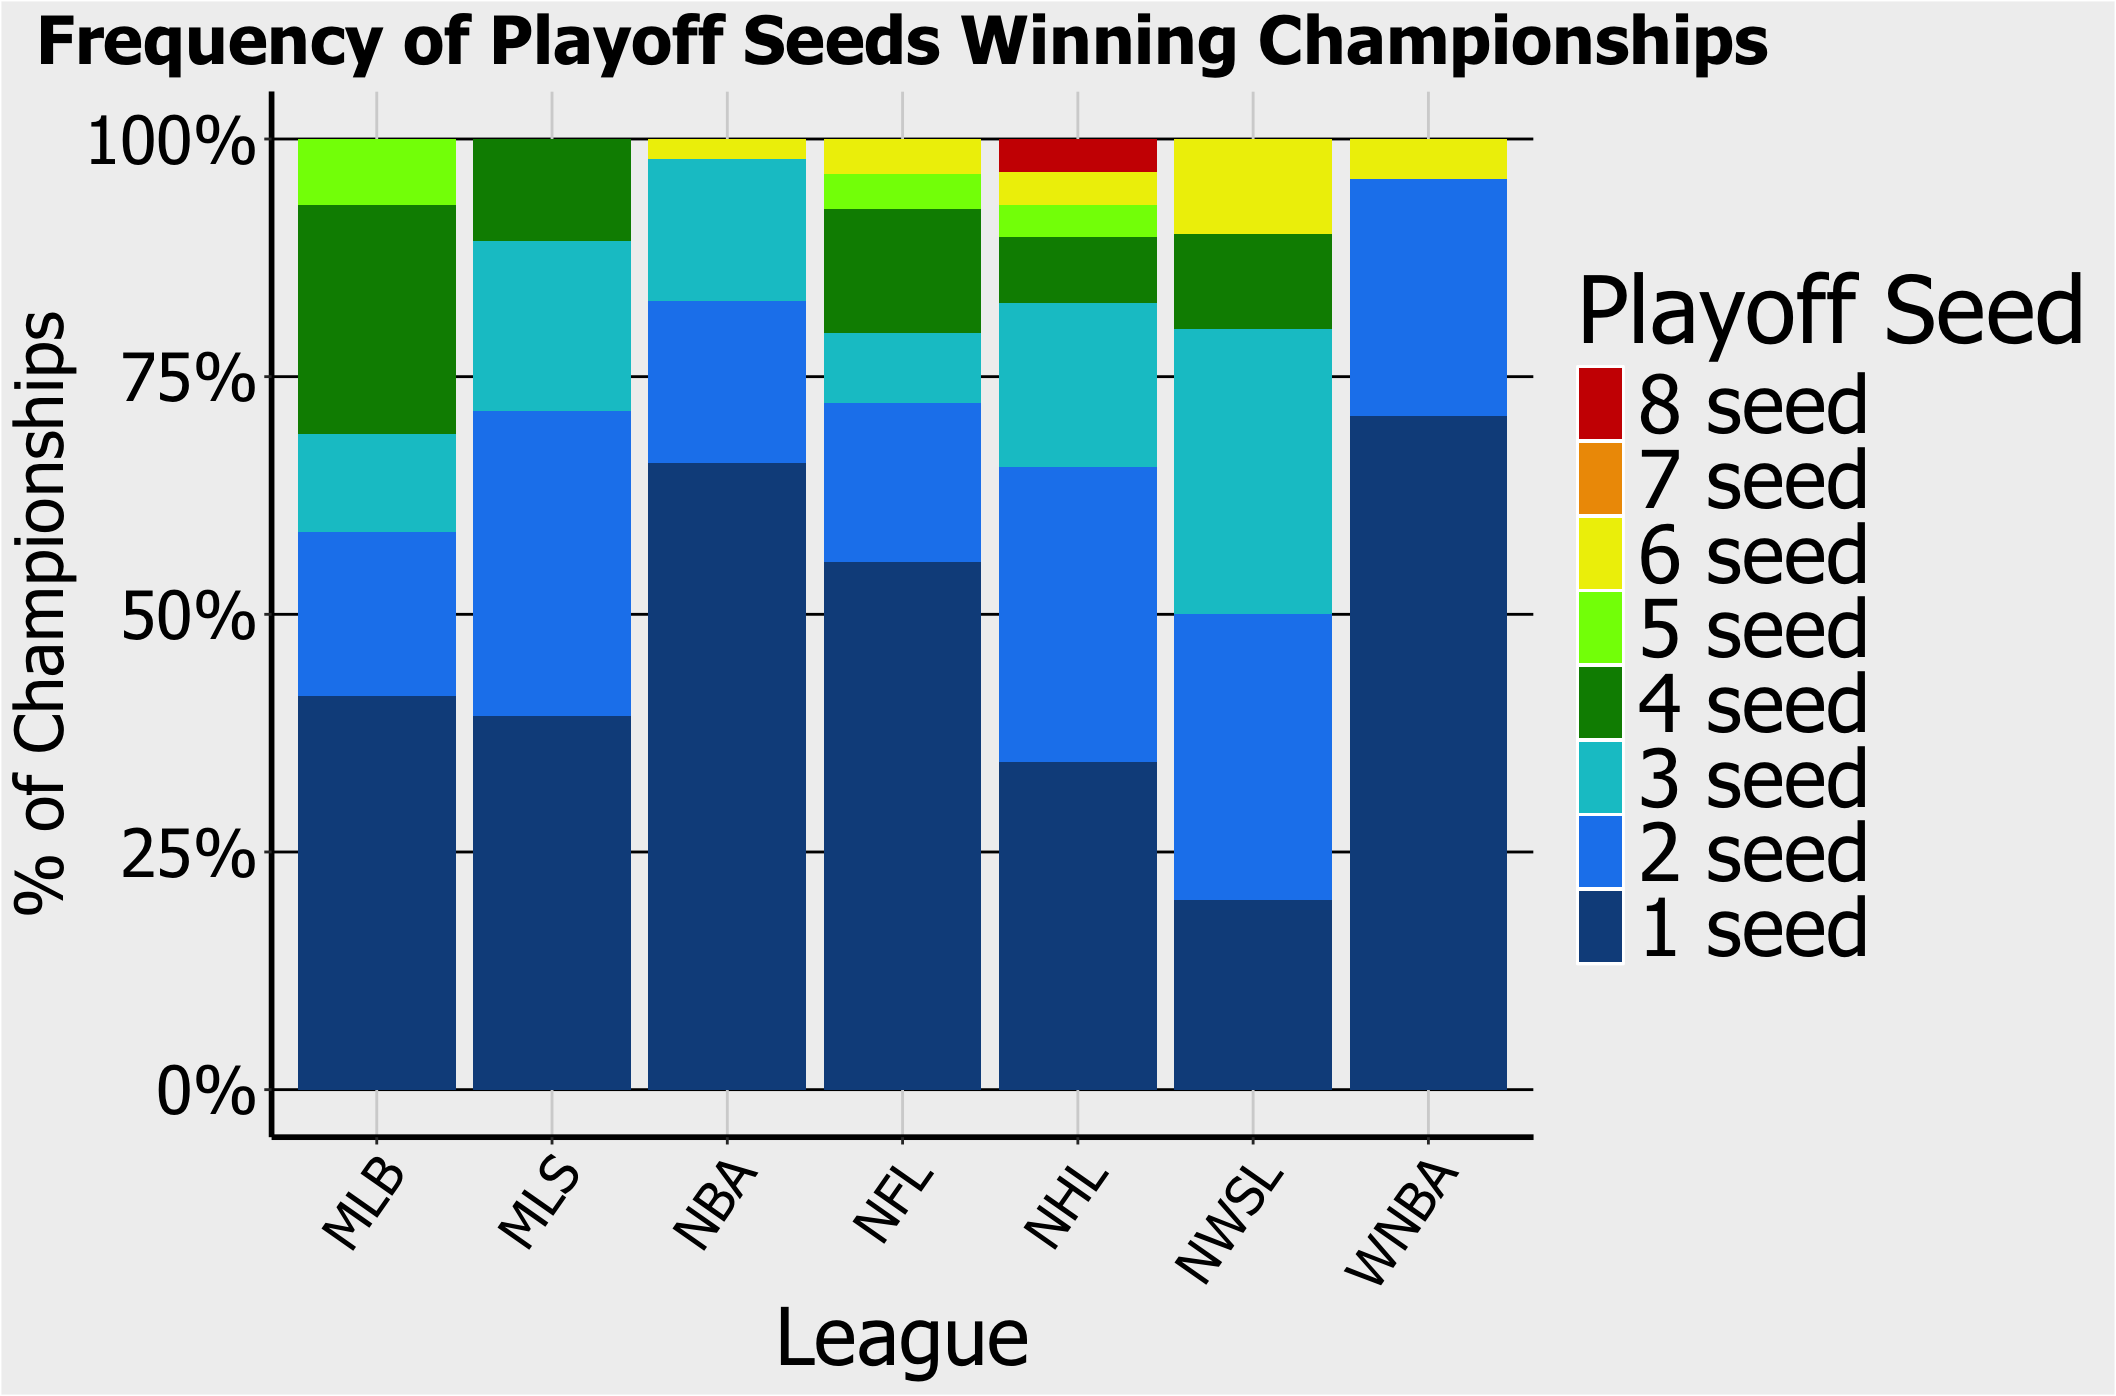
Each league has expanded the playoff field over the years, and occasionally has unique playoff brackets (e.g. Covid, player strikes). Our data travels back to the most significant expansion for each league (to be described in each league’s section). From this, the below chart shows how frequent each seed has won the league’s respective championship. The WNBA, NBA, and NFL are the only leagues with 1 seeds winning it all more than 50% of seasons. The NWSL, since its founding in 2013, crowns 3-= through 6 seeds as champions half the time. MLB, MLS, and NHL each see a 1 seed win it all about a third of seasons.
Since 1978, the highest seed to win the NBA finals was the 1994-95 Rockets as a 4 seed, otherwise championship teams have only been 1s, 2s, and 3s. Coming off a ‘93-‘94 championship, the Rockets added Clyde Drexler to their roster mid-season and hit form again in the playoffs. In both years Michael Jordan was away from the NBA for baseball, the Houston cashed in with back to back championships.
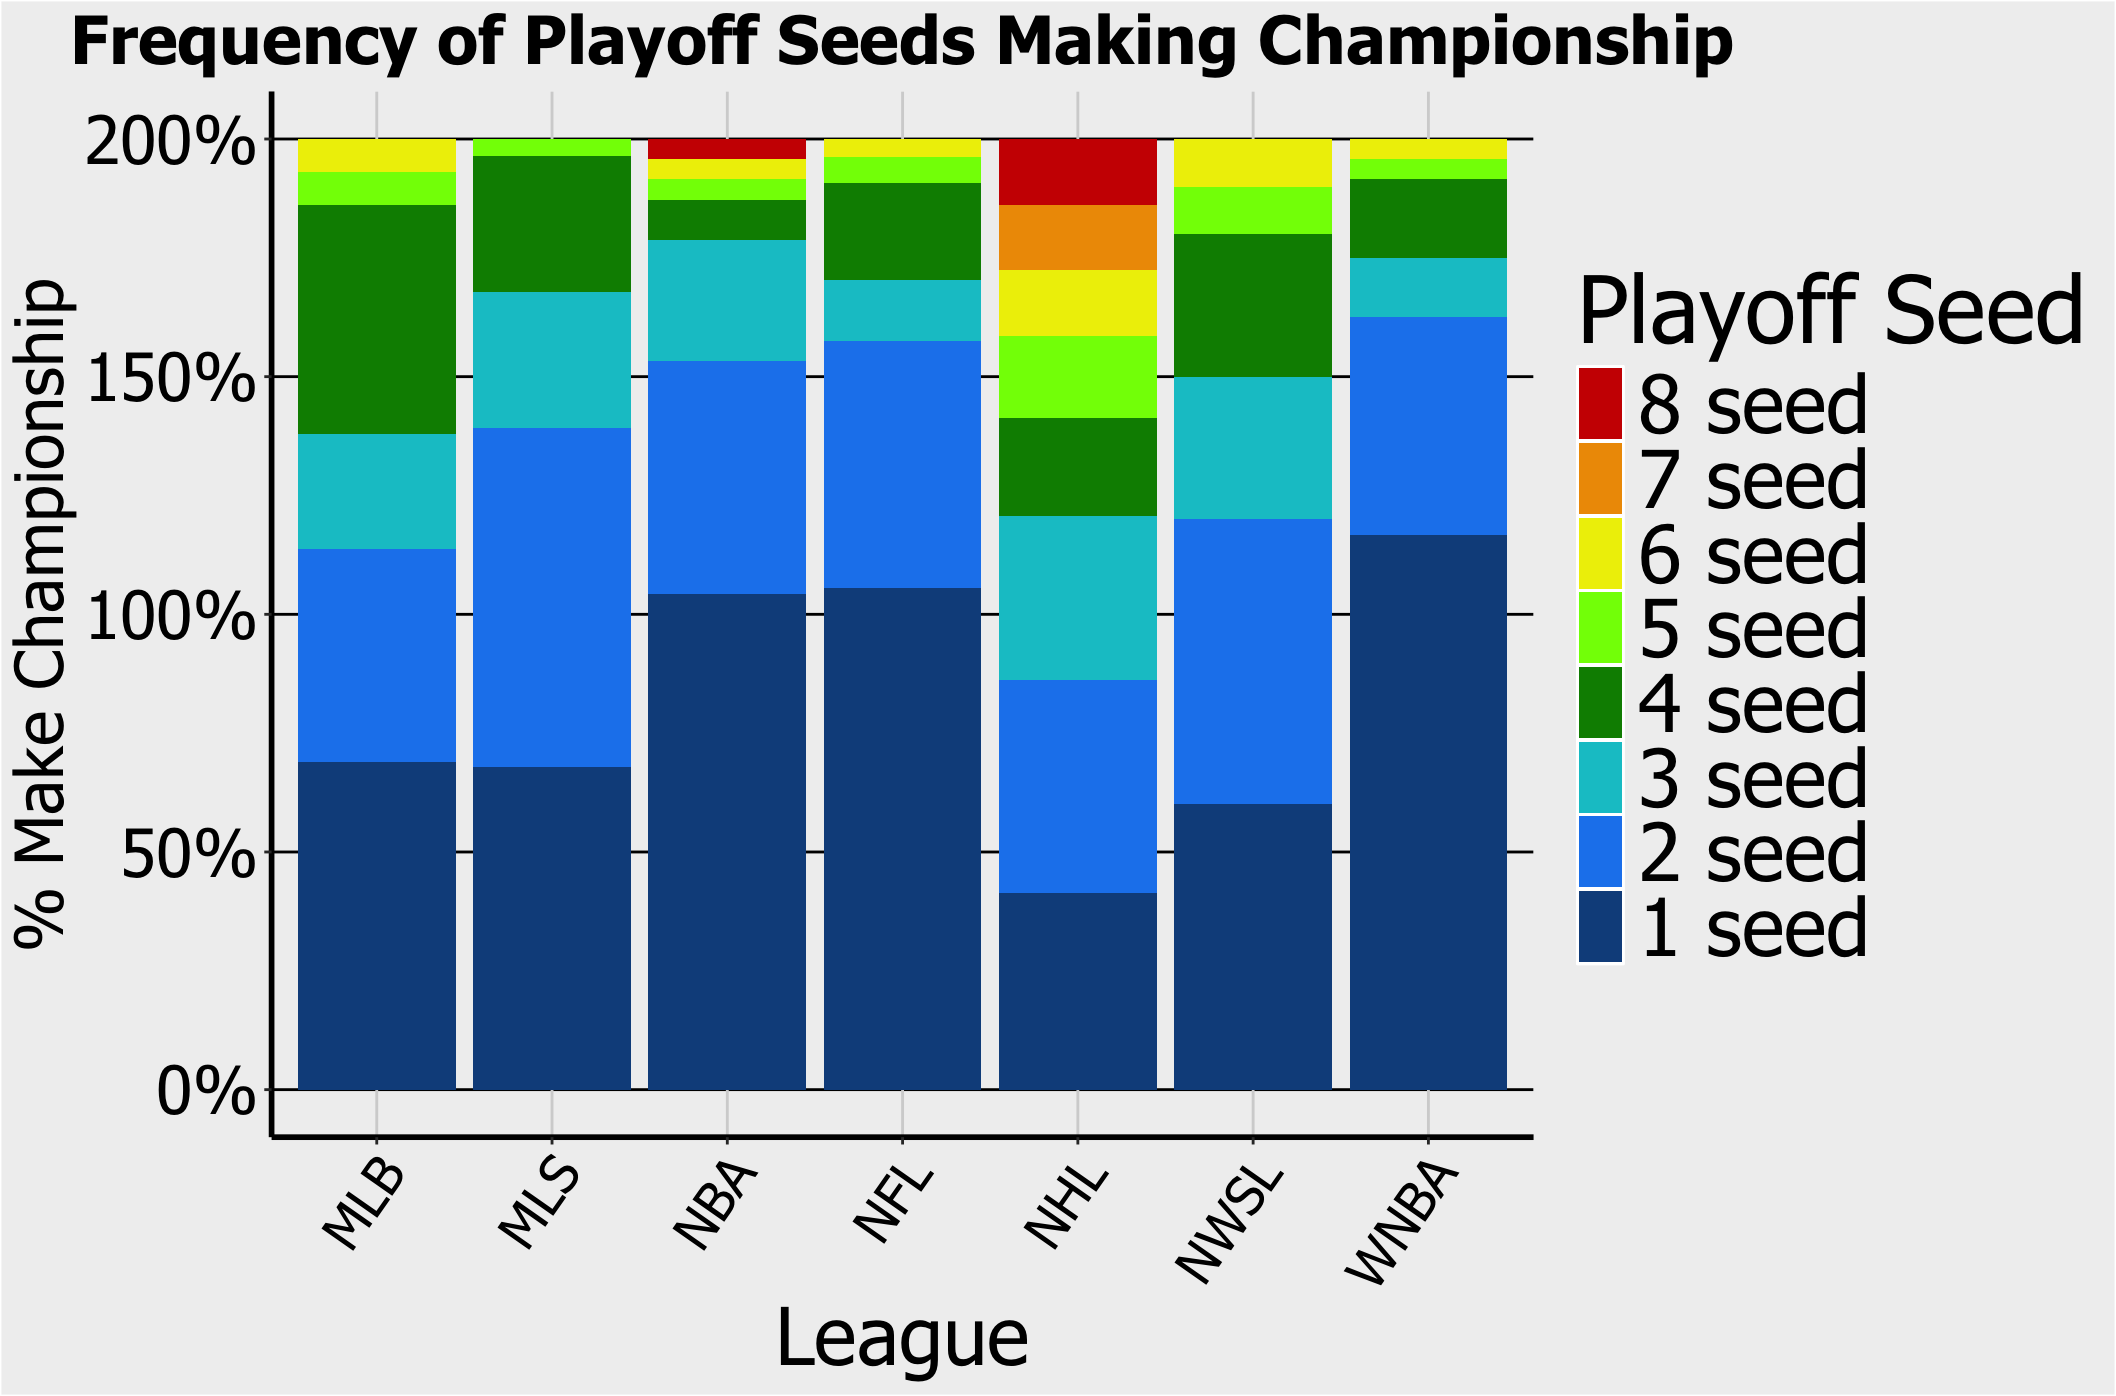
In addition to looking at league winners, the below chart shows how often each seed makes the championship.
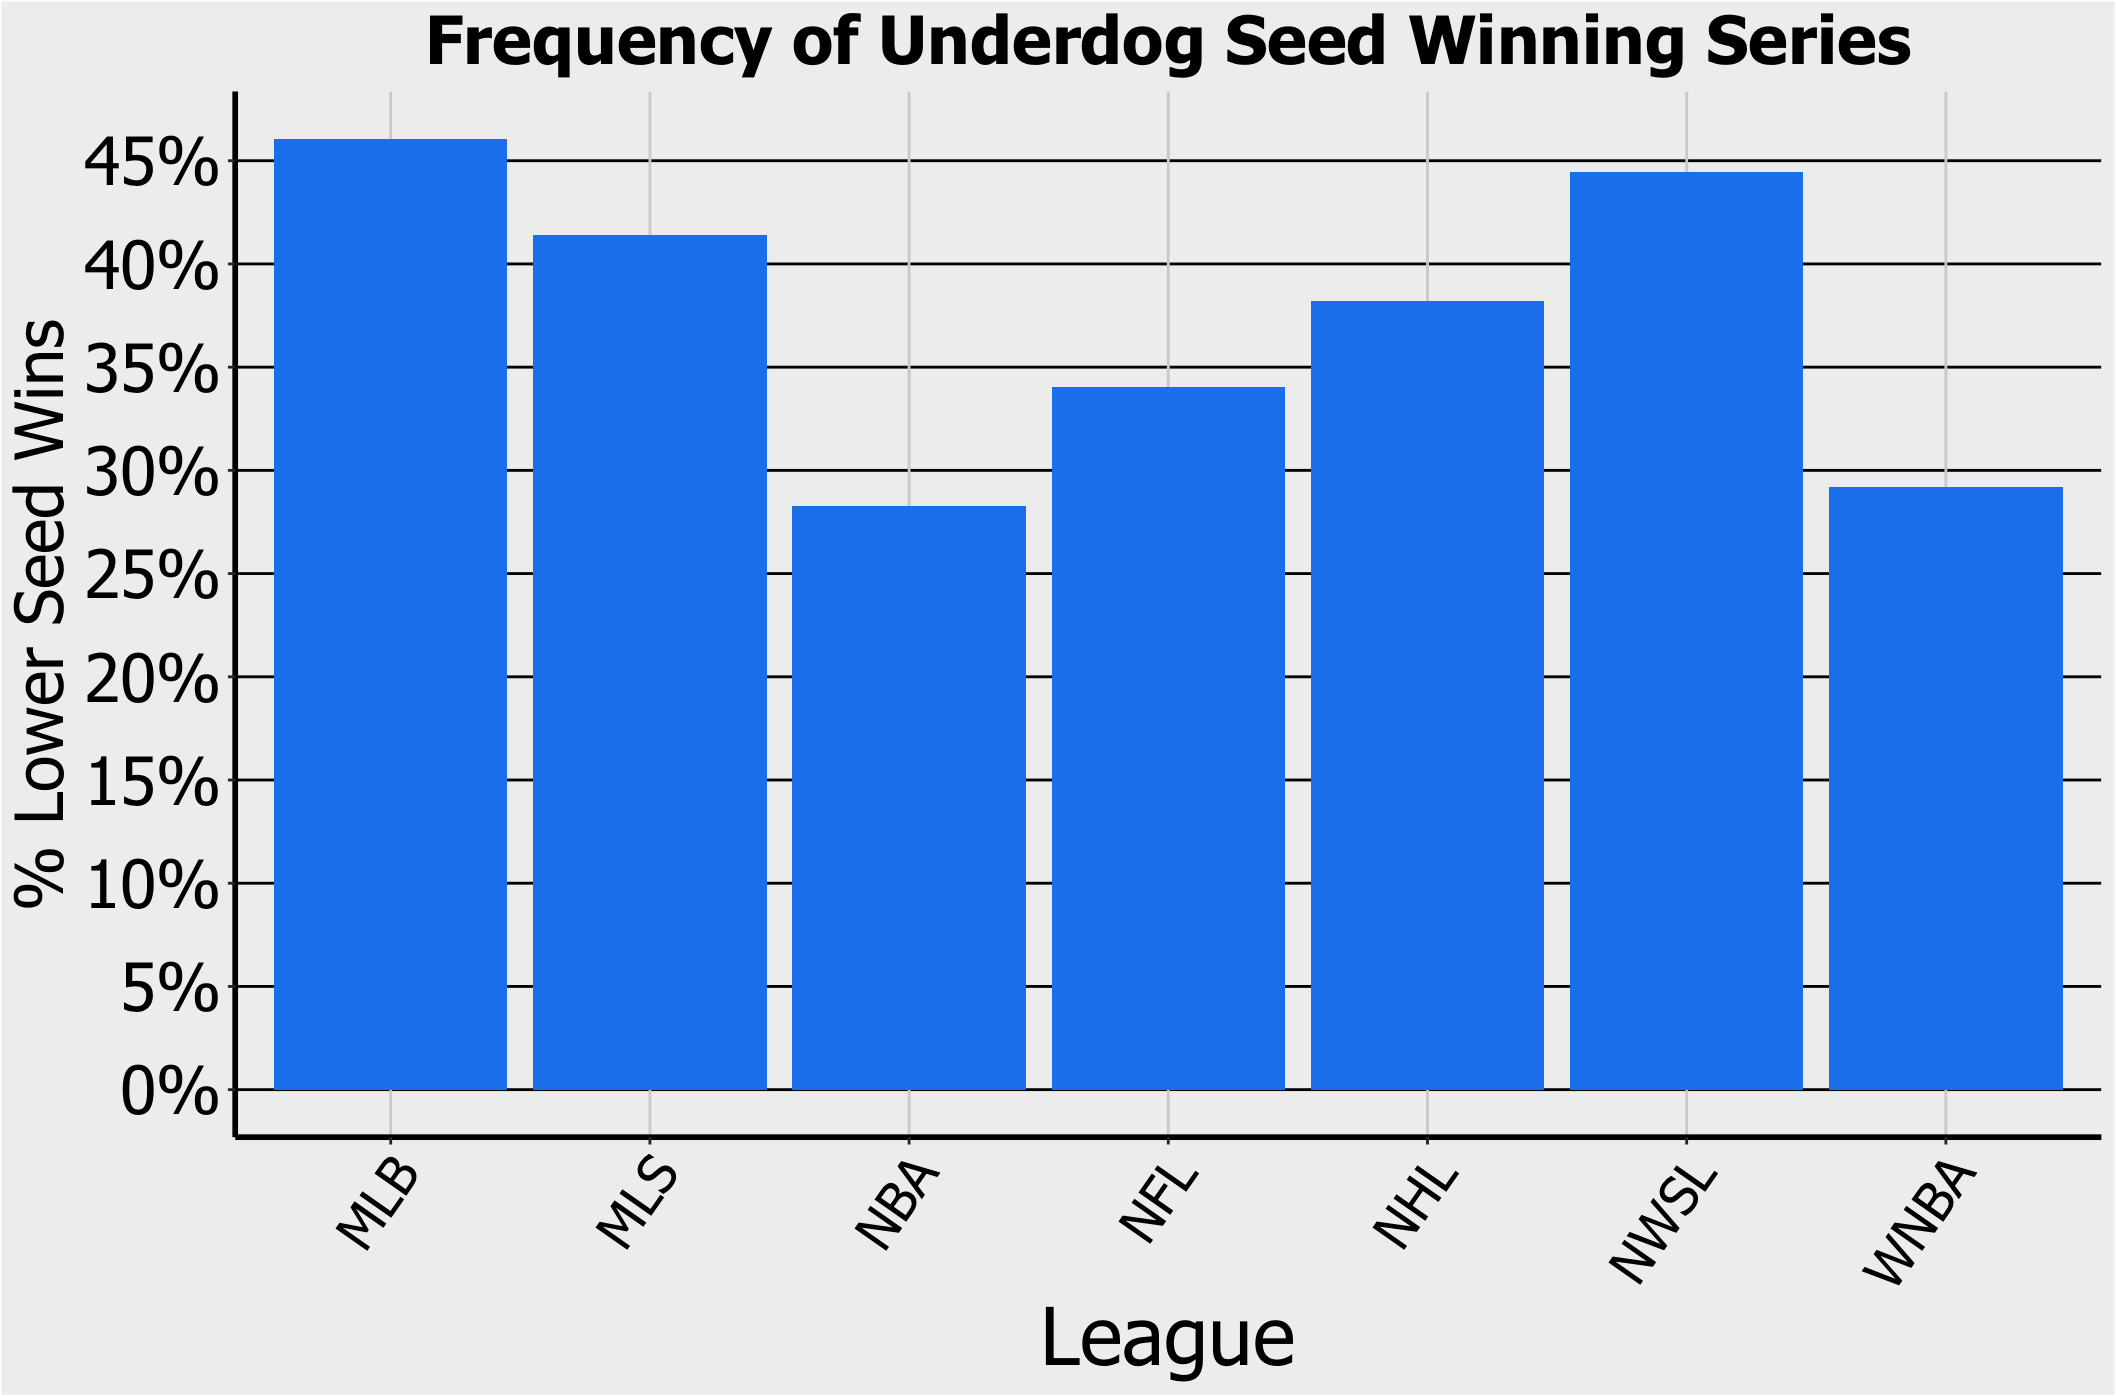
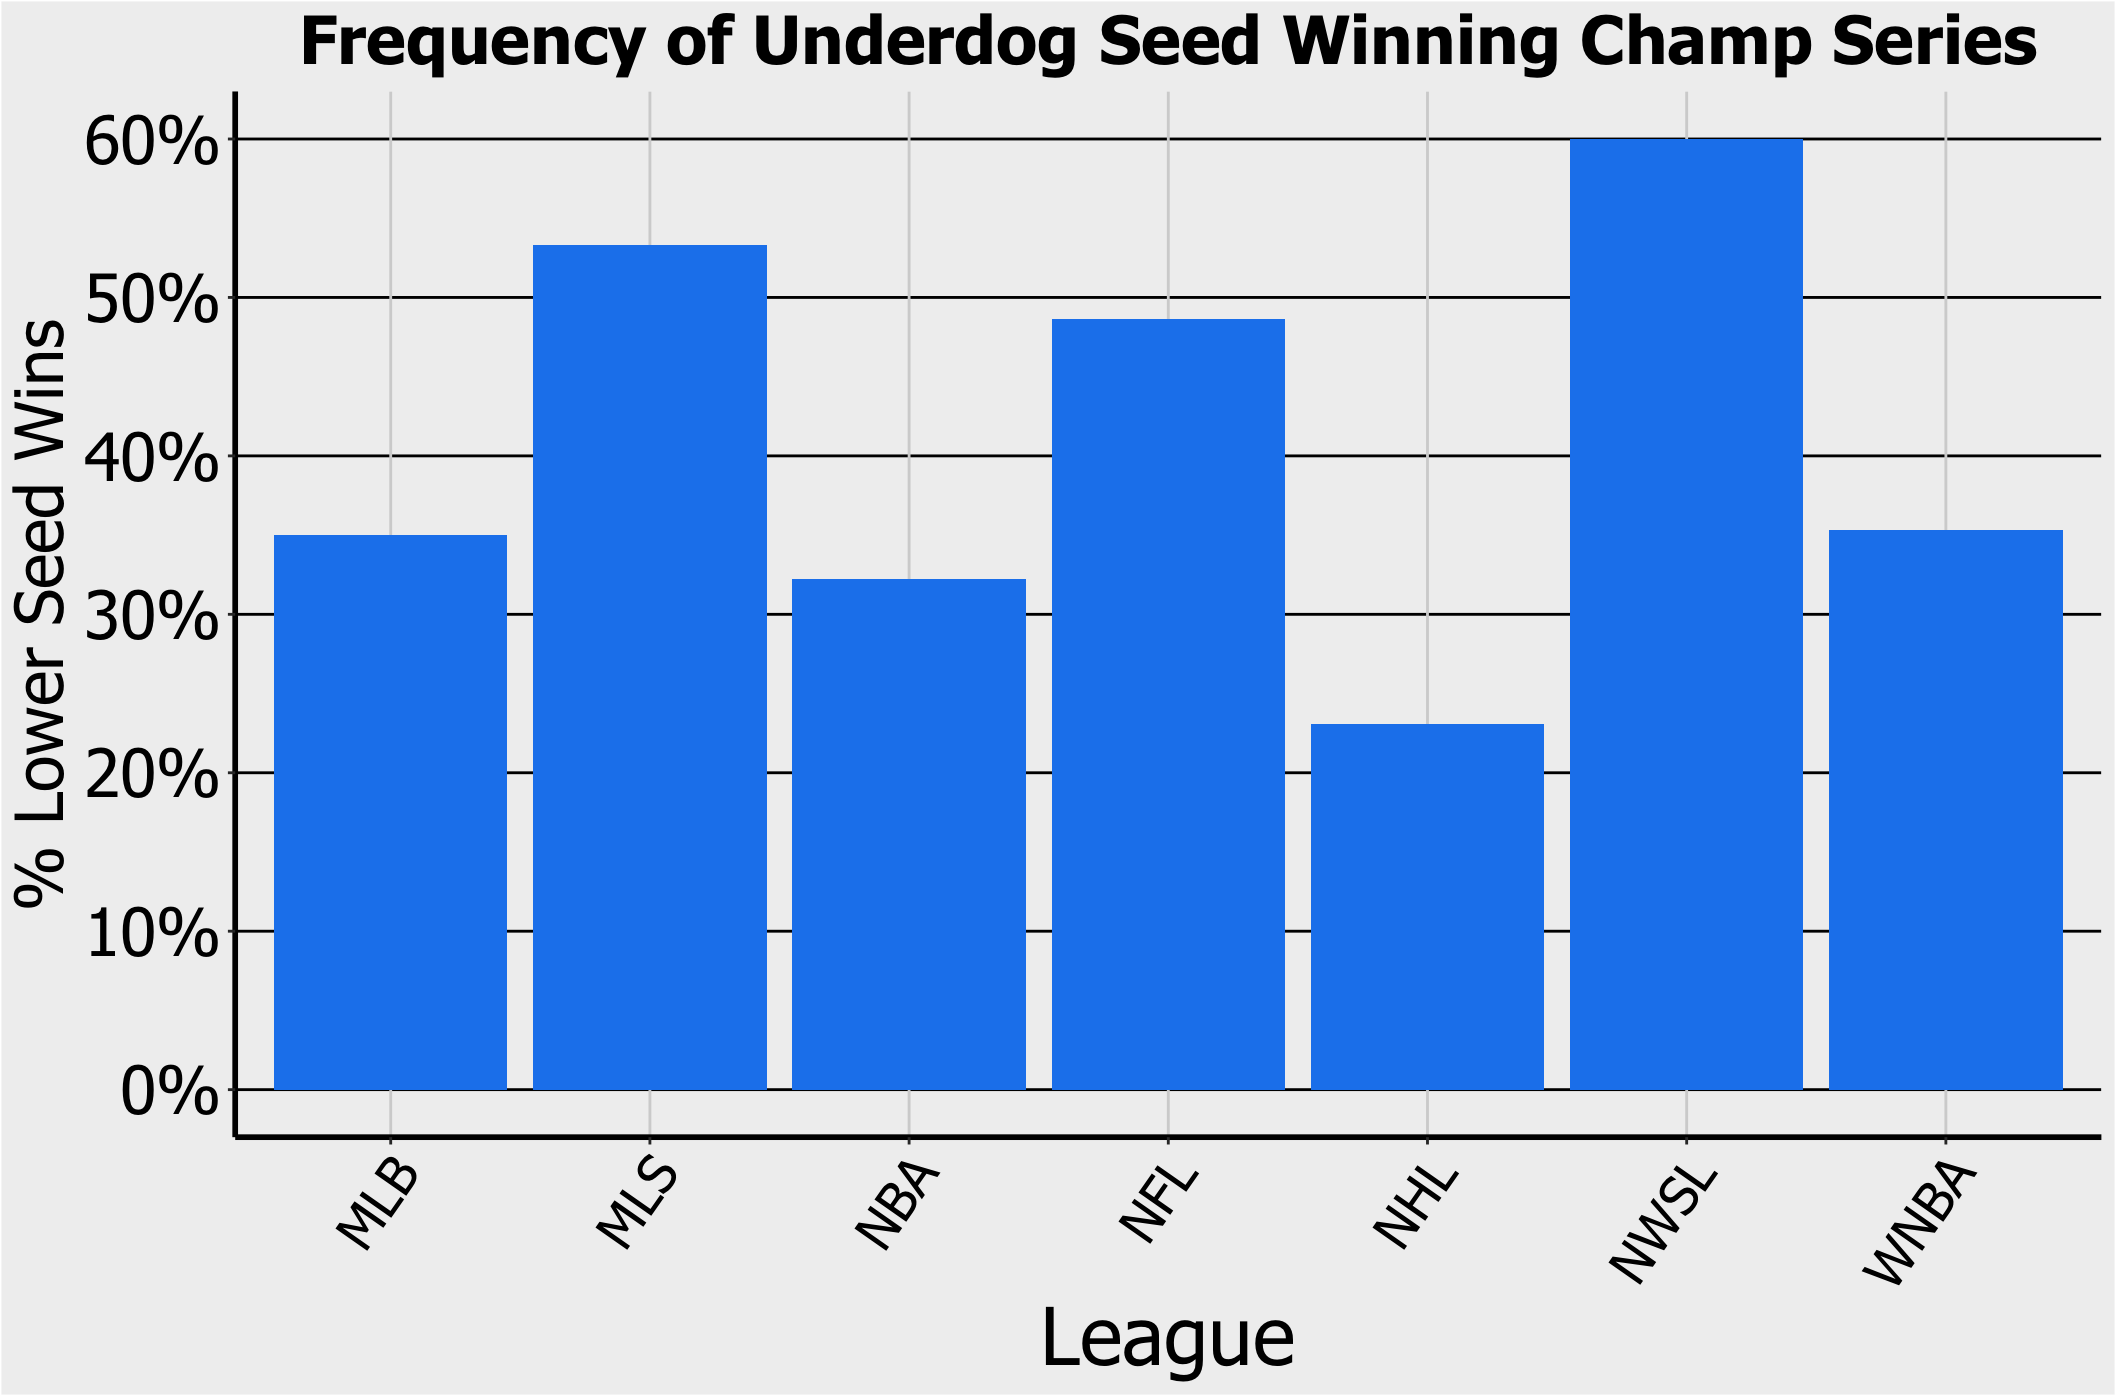
The next two charts show the percent of total playoff series won by the underdog seed, and the total championship series won by the underdog seed. As expected, the NBA and WNBA have the fewest upsets. In leagues such as MLB and NHL that prioritize division results over conference/league results to determine playoff brackets, we sometimes find the lower seed is actually the better team, or at least much closer in range of their opponent compared to other leagues. For example, in 2017 the Penguins and Blue Jackets finished 2nd and 3rd in points in the NHL Eastern Conference. However, since they were also 2nd and 3rd in the Metropolitan Division, they matched up in the first round, where you typically would not see the 2nd and 3rd best teams featured together. And in MLB, you sometimes have the 3rd seeded division winner with fewer regular season wins than their wild card opponent.
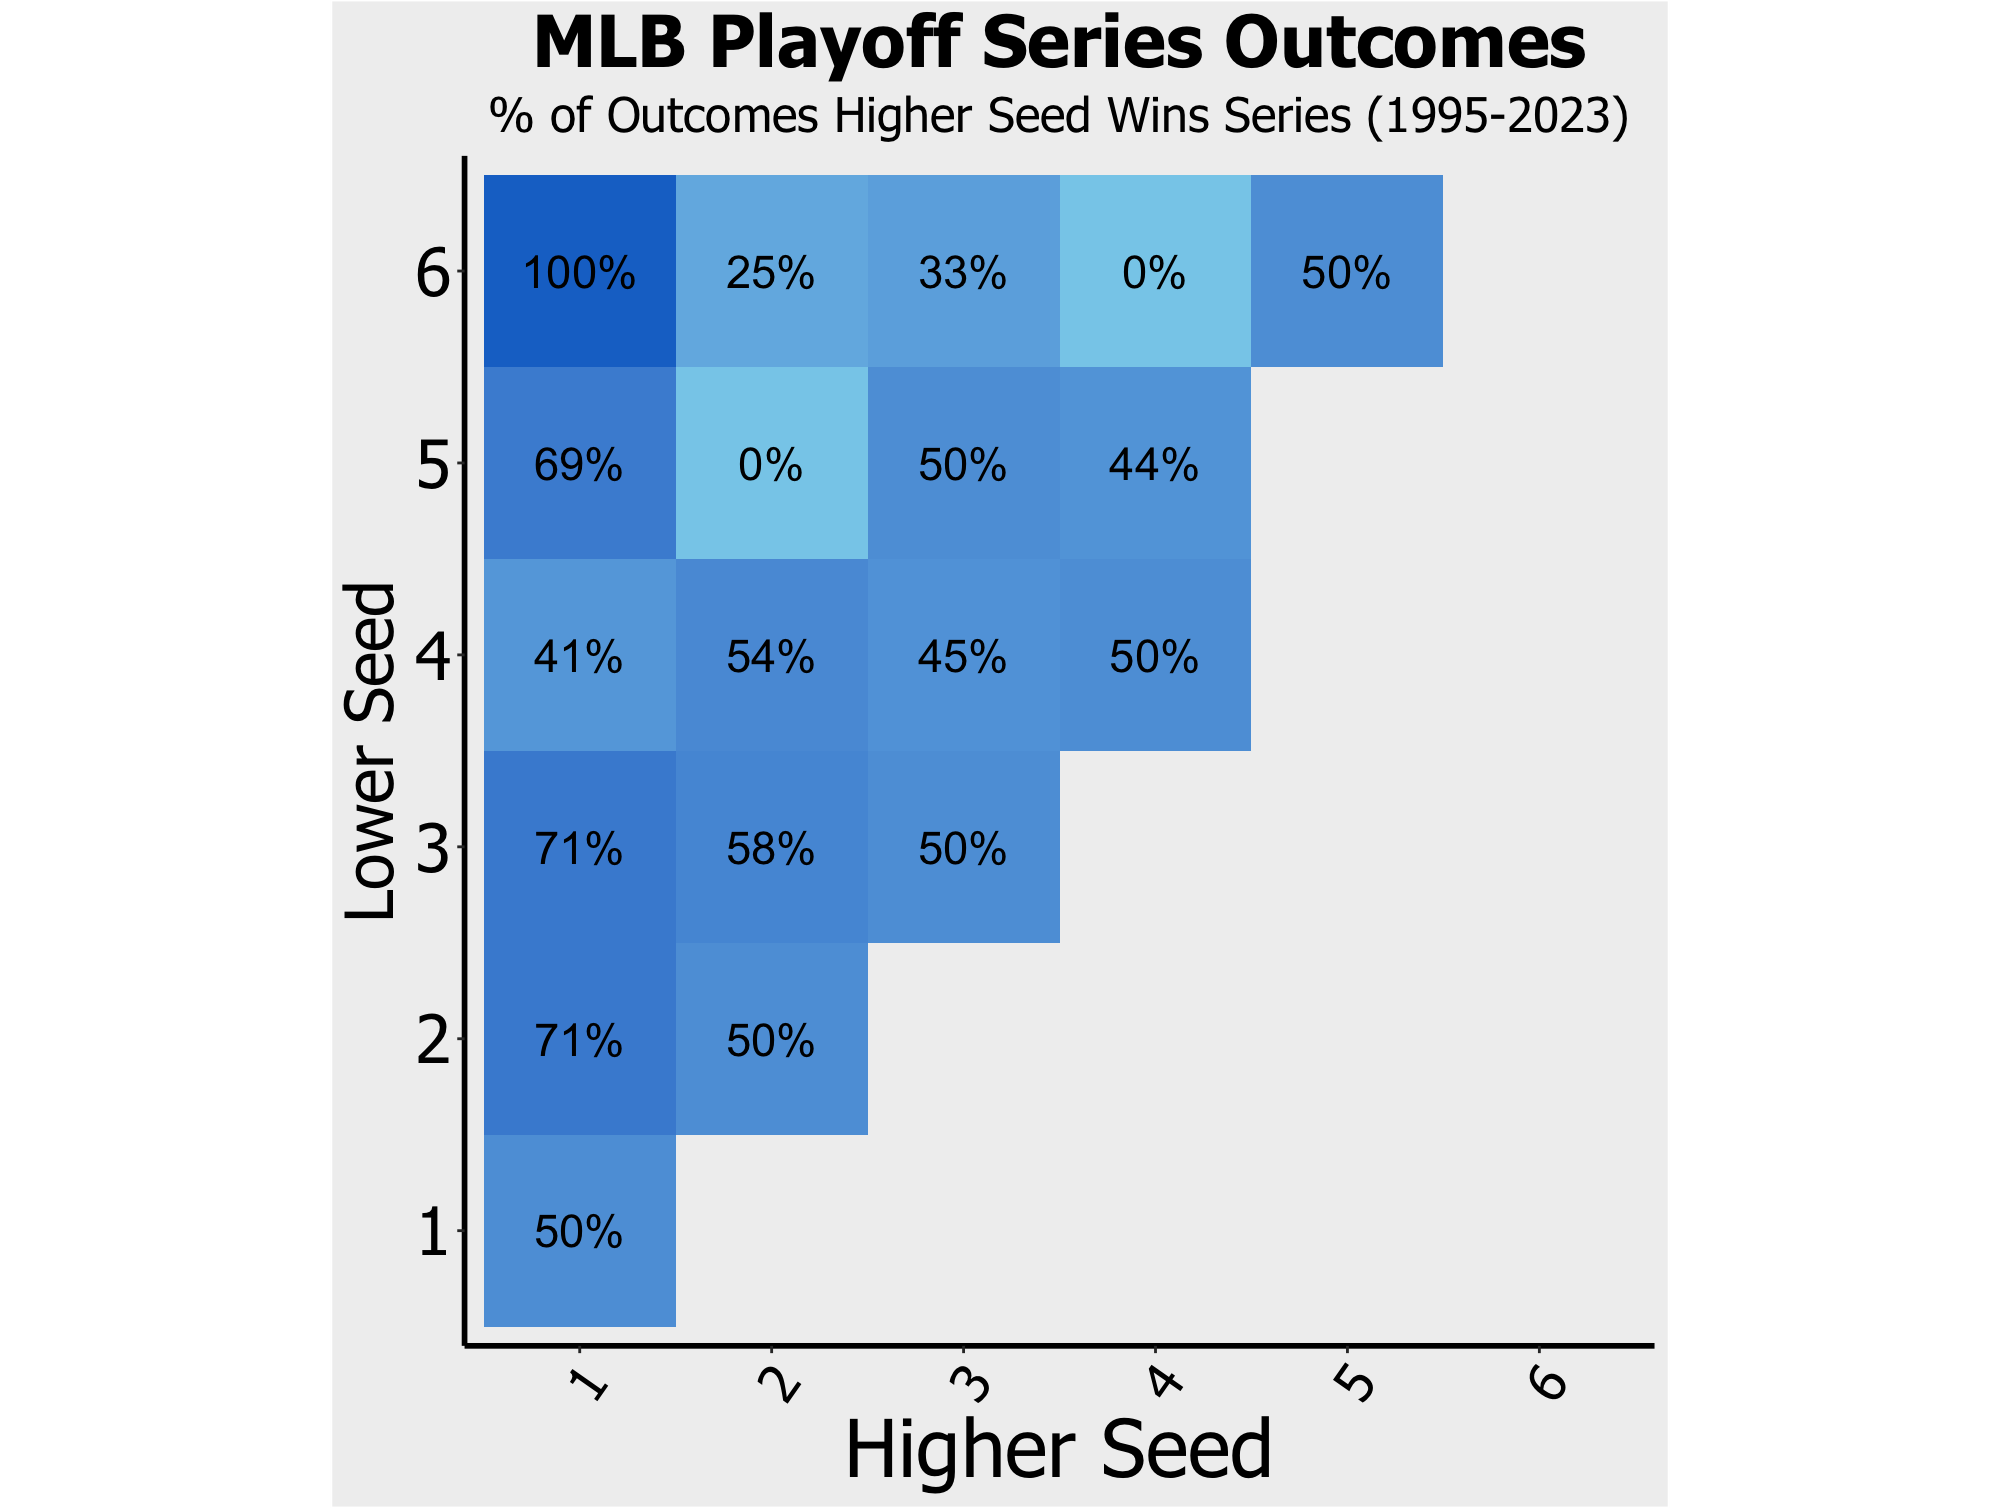
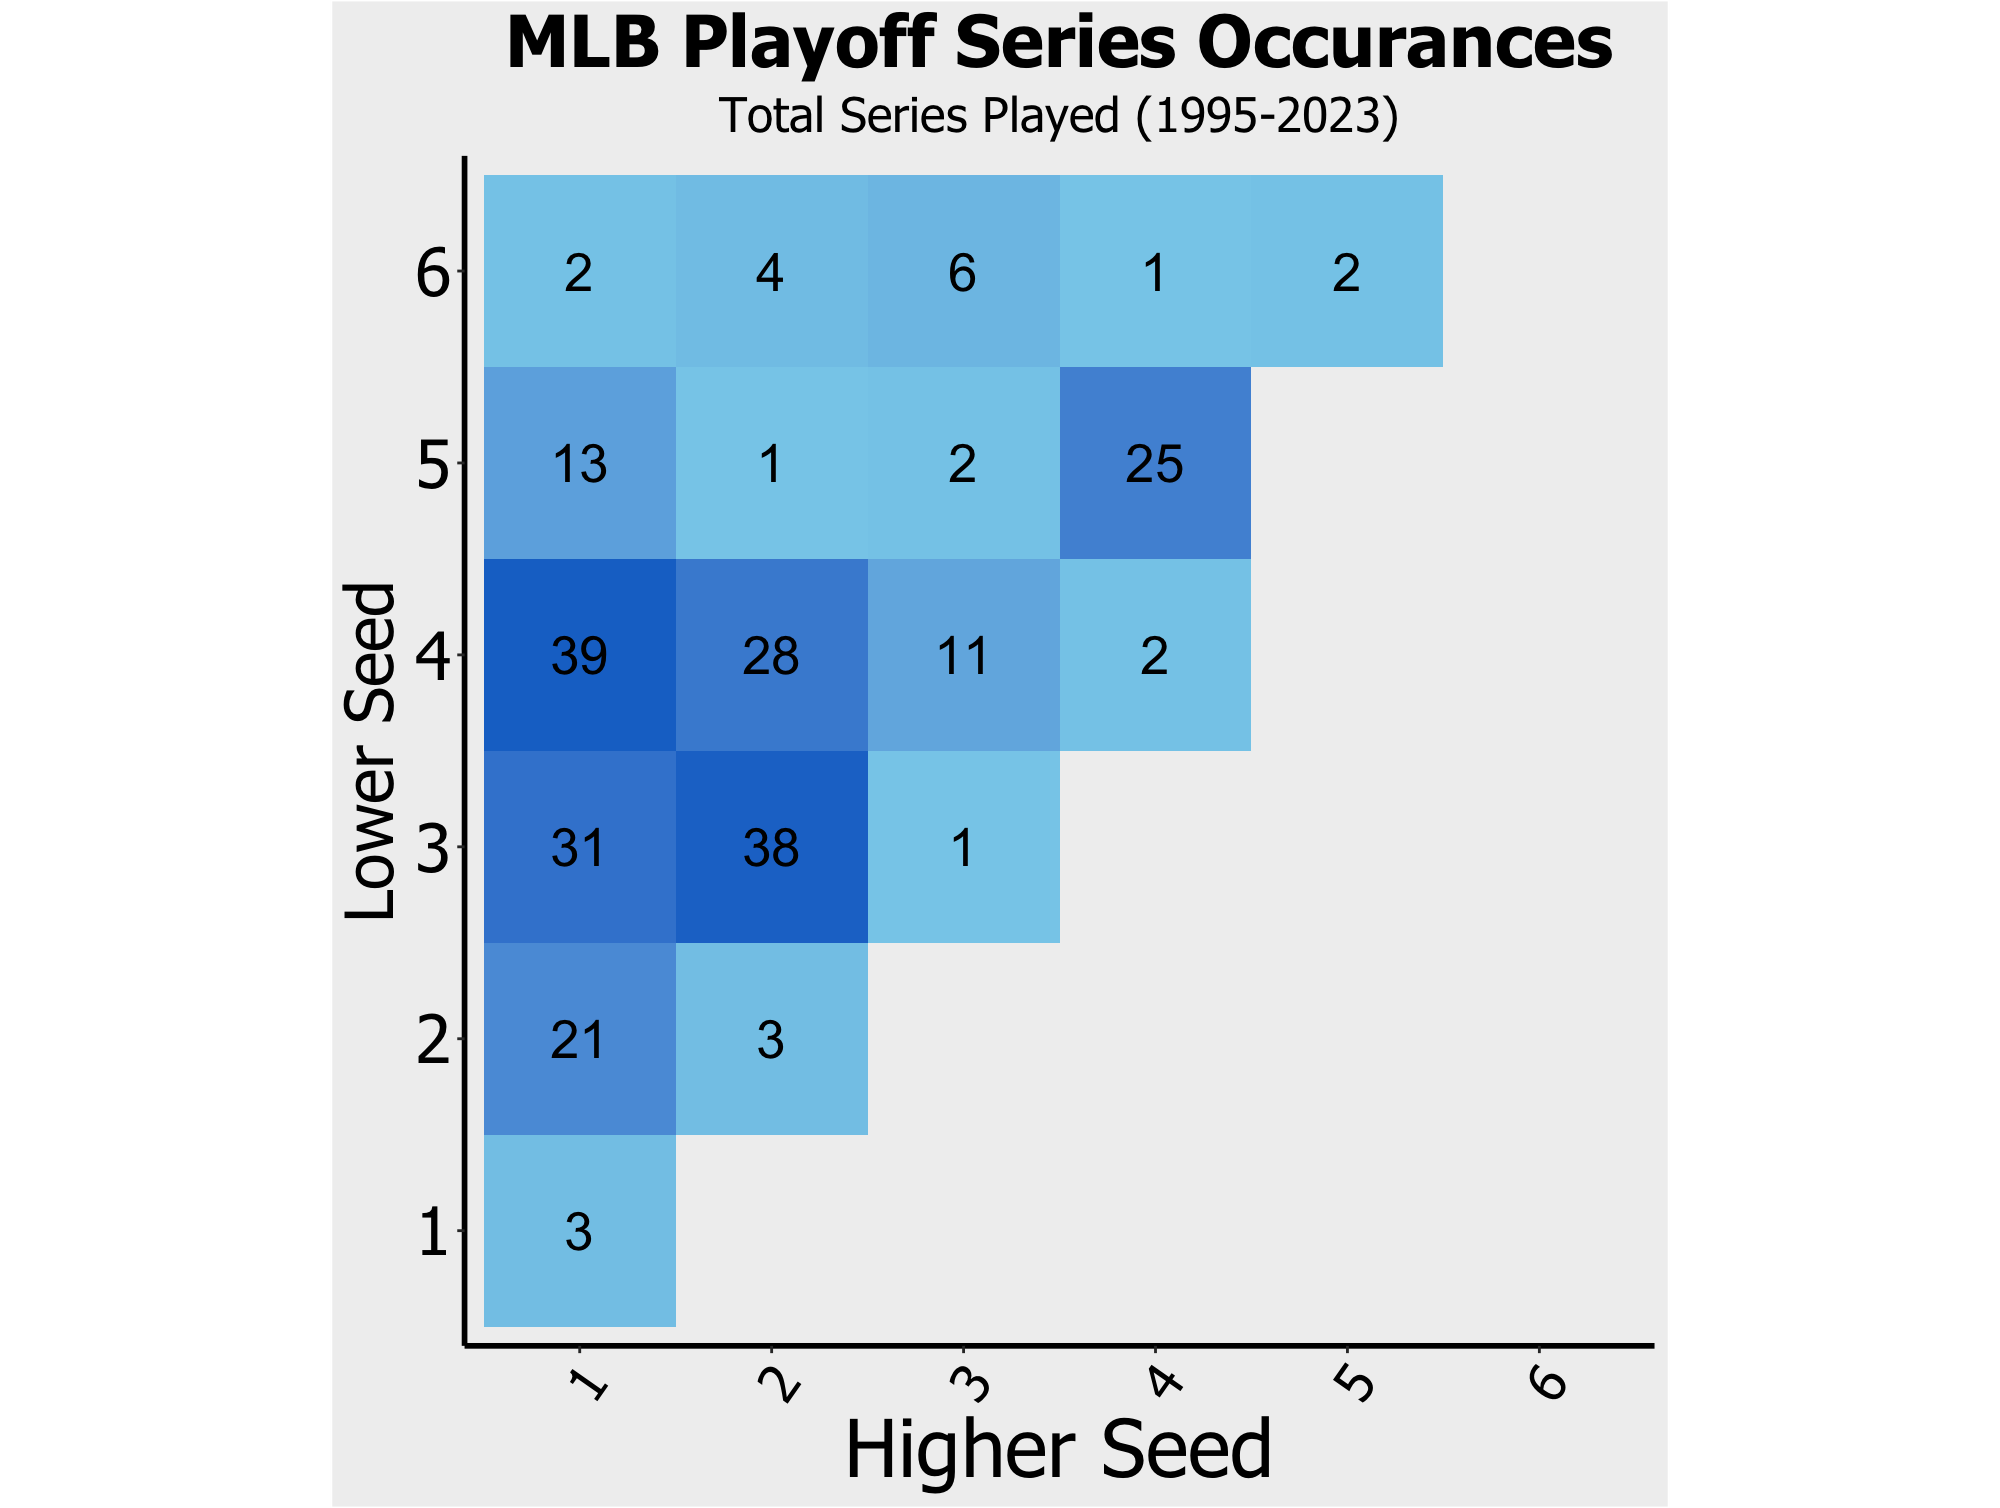
Next we will dive into the heat maps that show how seeds do against one another (and how often they match up) in each league. The different style brackets, number of teams making the playoffs in each league, and nature of each sport result in a variety of different outcomes.
Starting with MLB, we go back to 1995 when the league expanded the playoffs from 4 teams to 8, and the most surprising takeaway is that 4 seeds win out 23 to 16 against 1 seeds. Since 1997, 7 times a 4 seed has won the World Series, in each case defeating a 1 seed in the division series, and 3 times defeating a 1 seed again in the World Series. Additionally, just 3 times out of the past 29 seasons has a World Series been played with both 1 seeds. The most recent being in 2013 when the Red Sox beat the Cardinals.
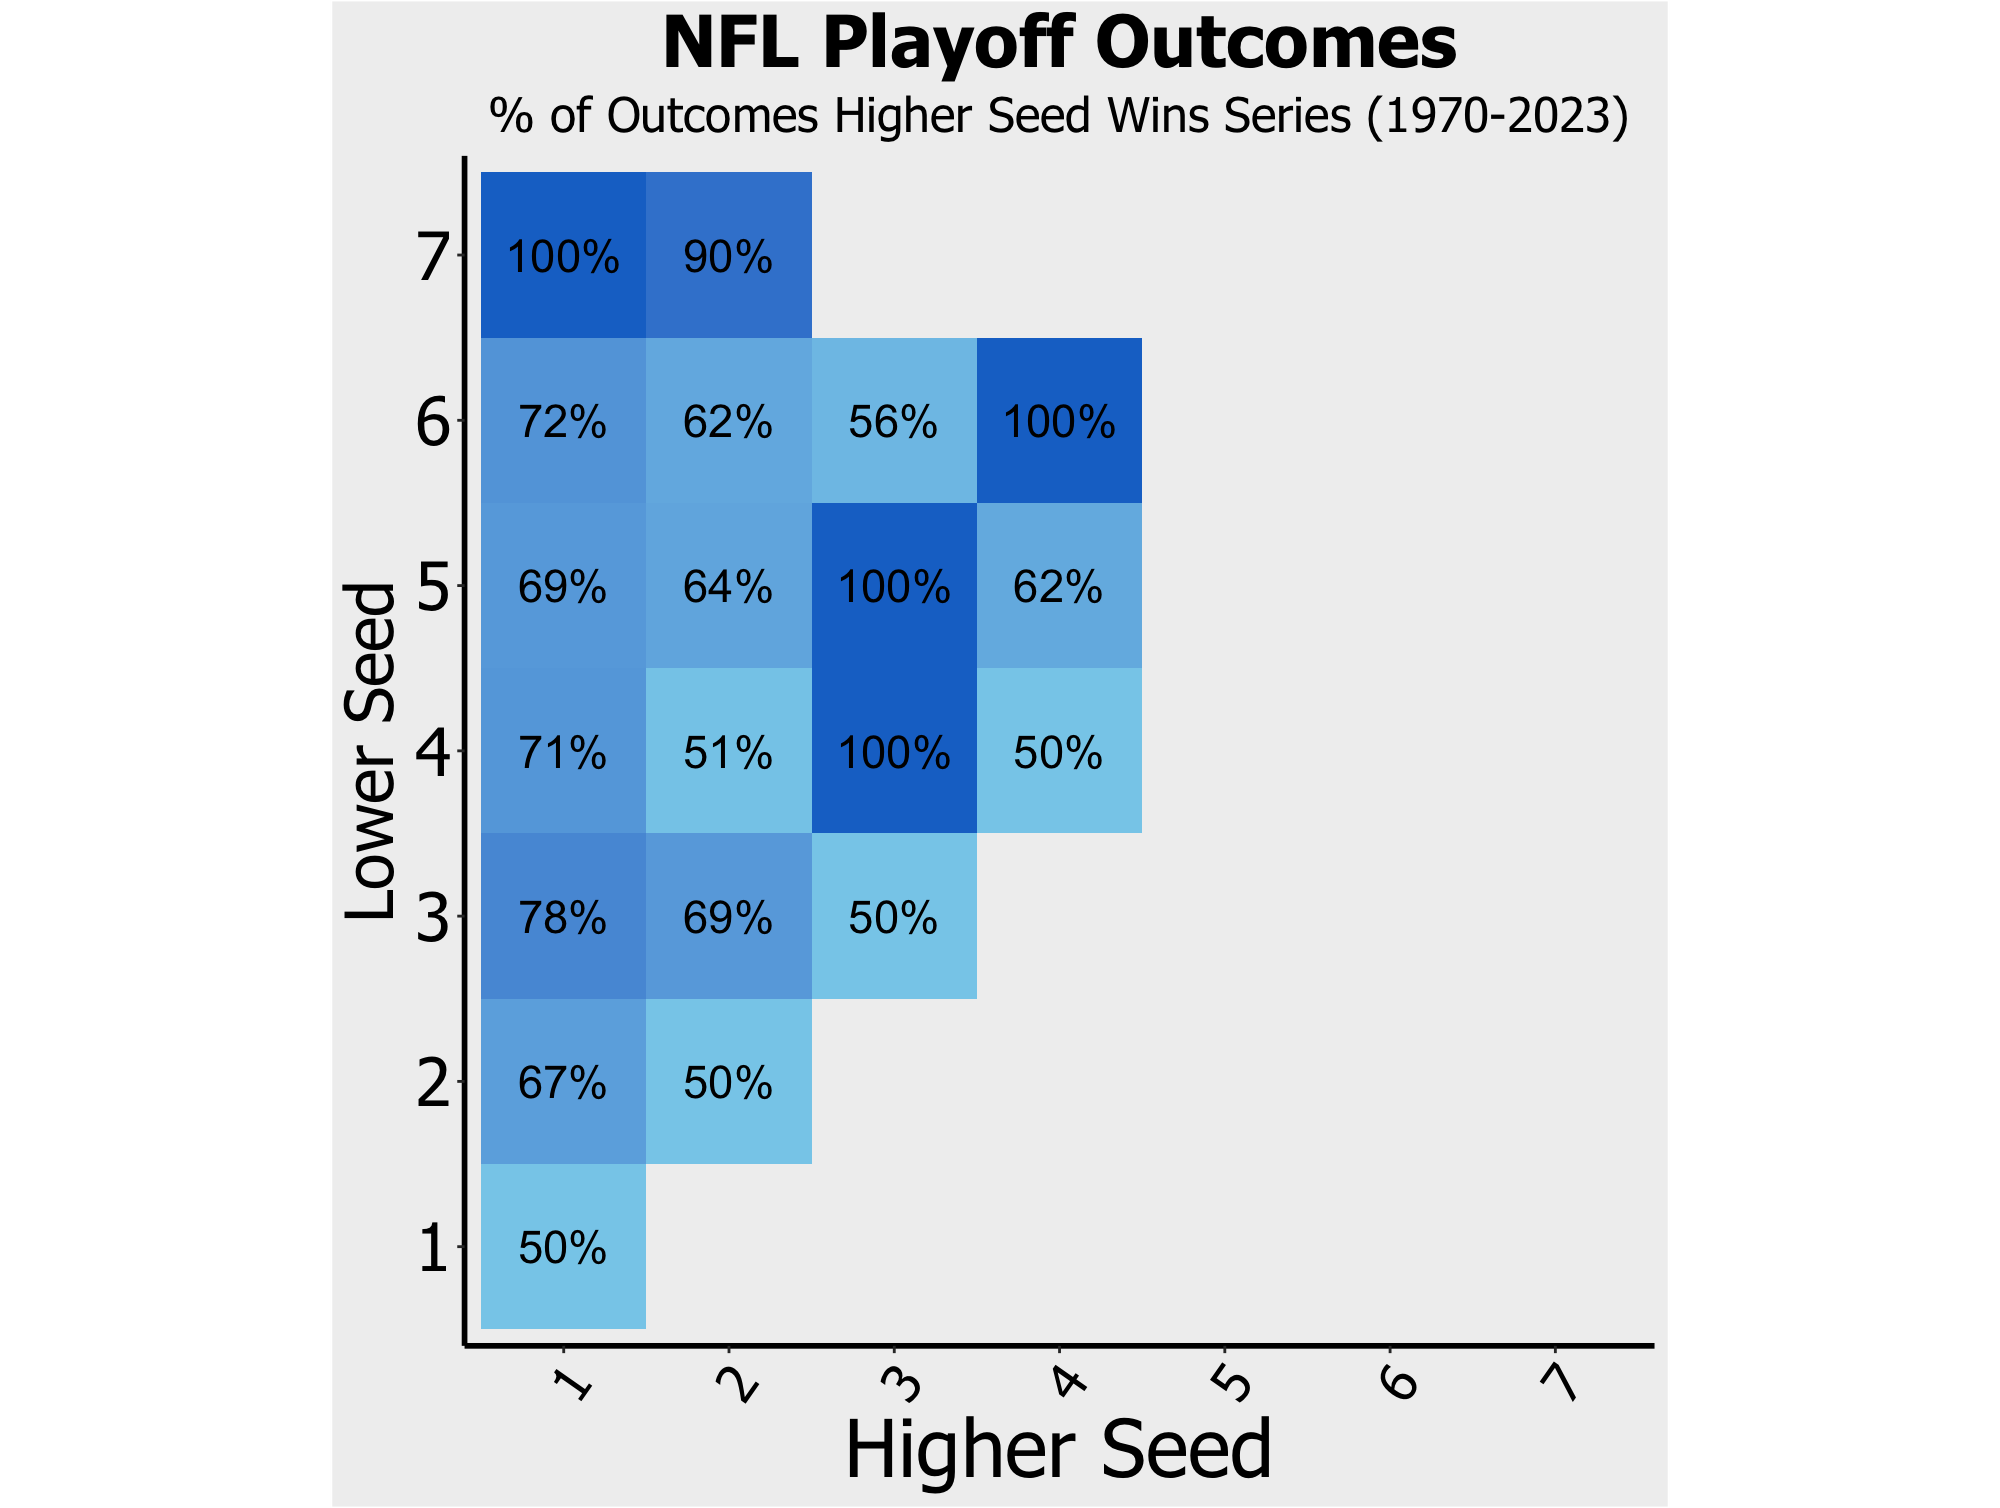
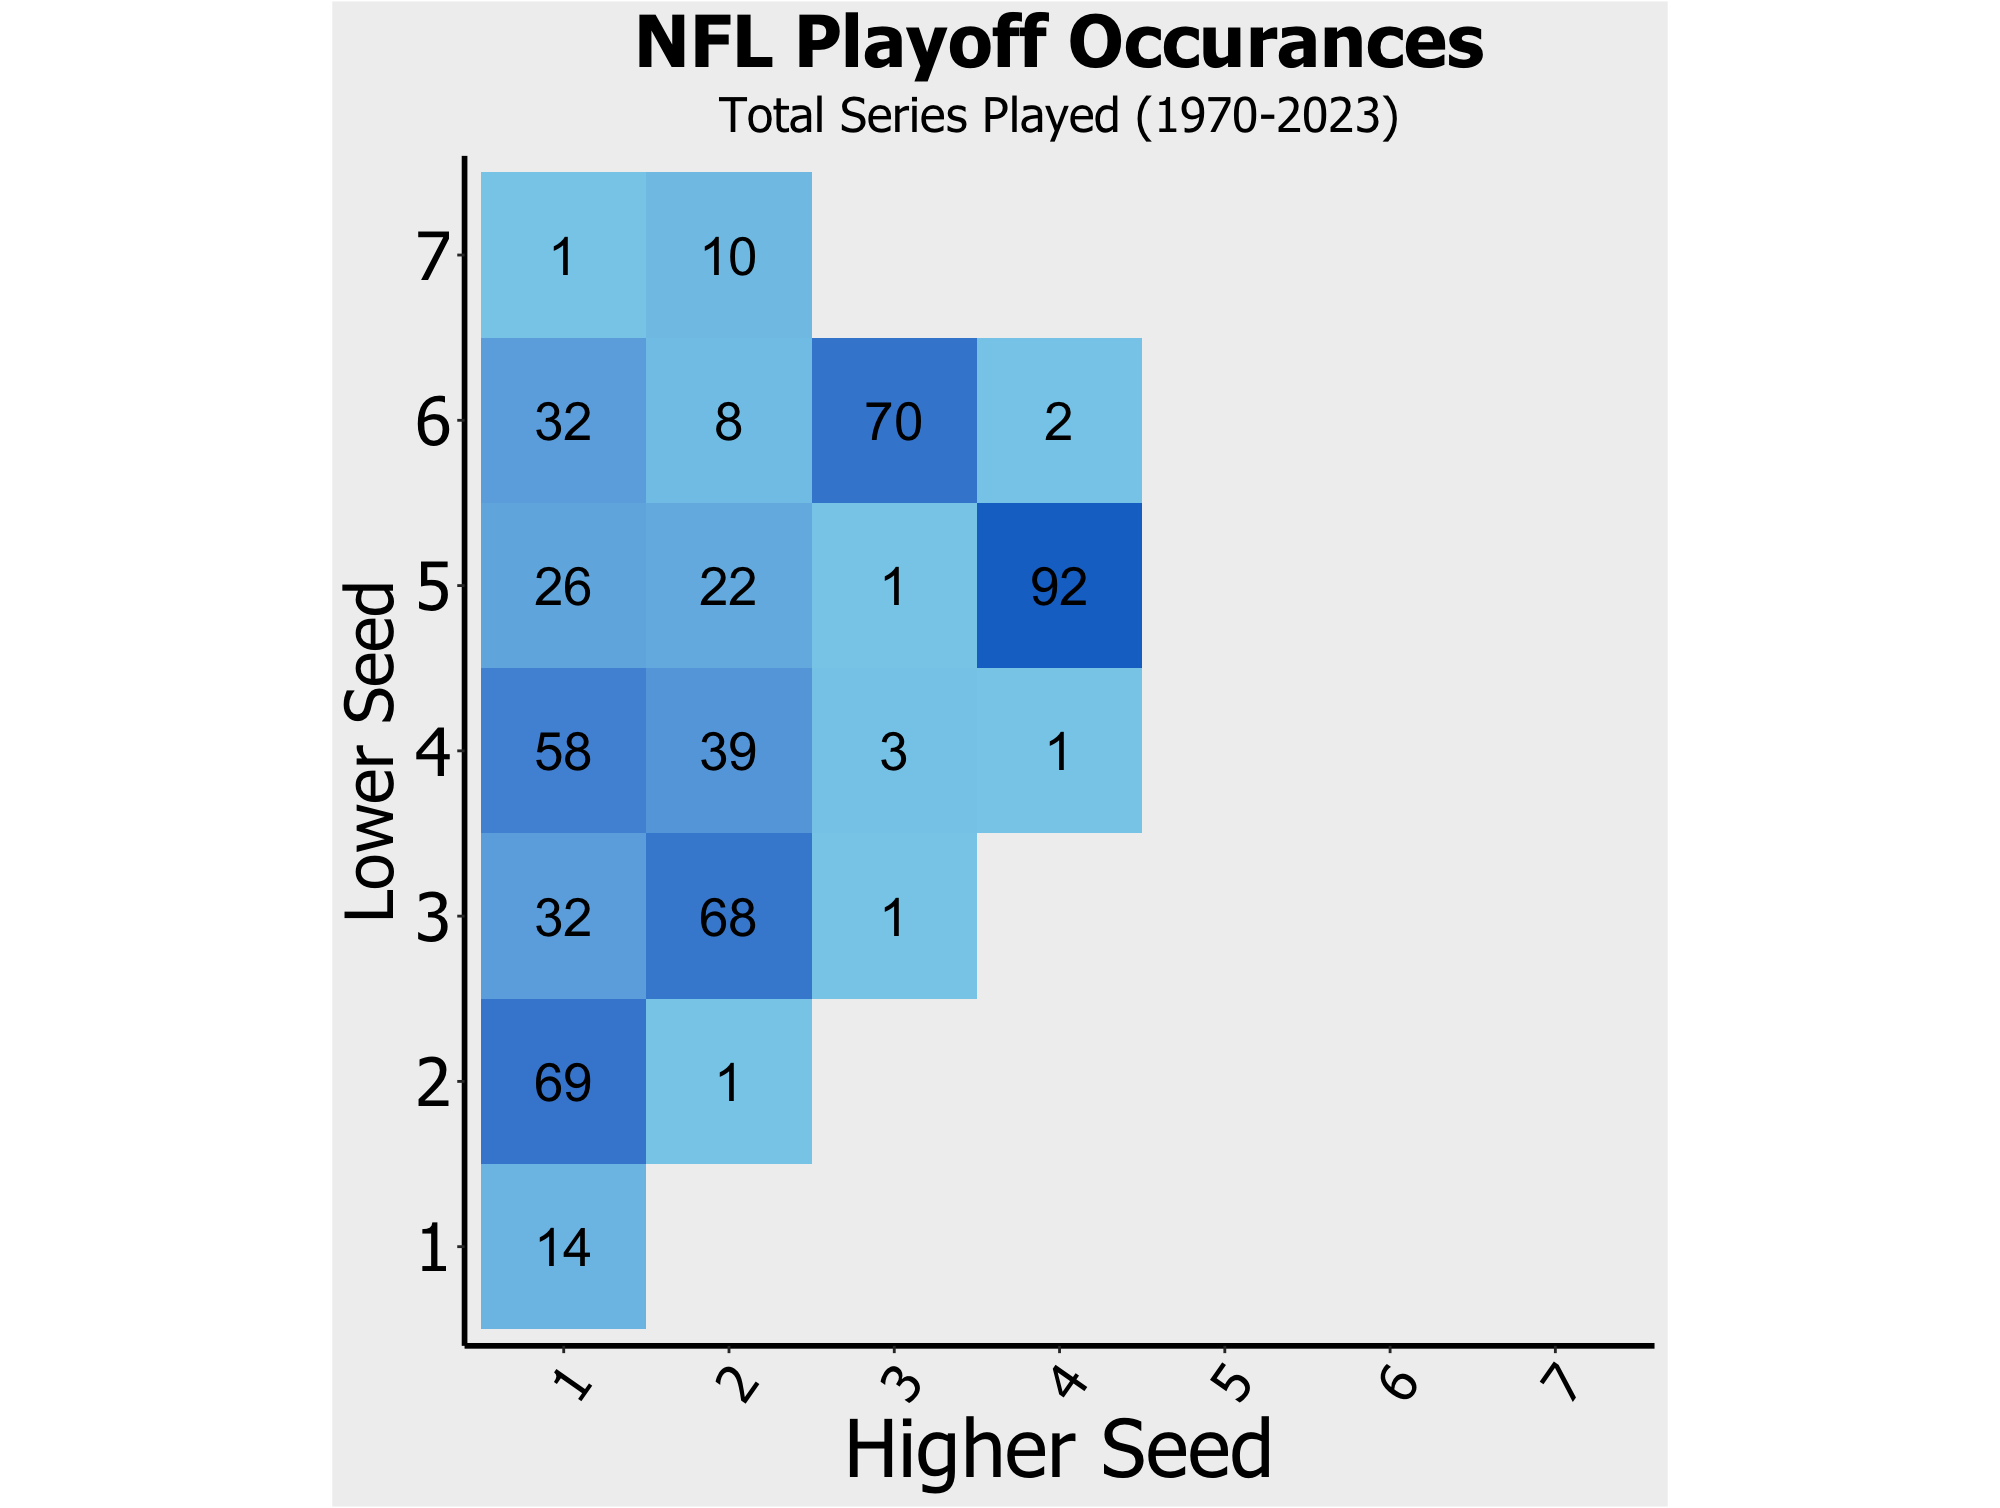
Moving on to the NFL, we go back to the 1970-71 season when the the playoffs also went from 4 to 8 (currently 14). There actually is no combination where lower seeds win more often than higher seeds, but several that are close. The 39 “4 vs 2” match ups played out in favor of the 2 seed by a record of 20-19 and of the 70 “6 vs 3” match ups, the 6 seed has been victorious 31 times. The nature of reseeding also allows us to see a variety of unique match ups that otherwise wouldn’t be common.
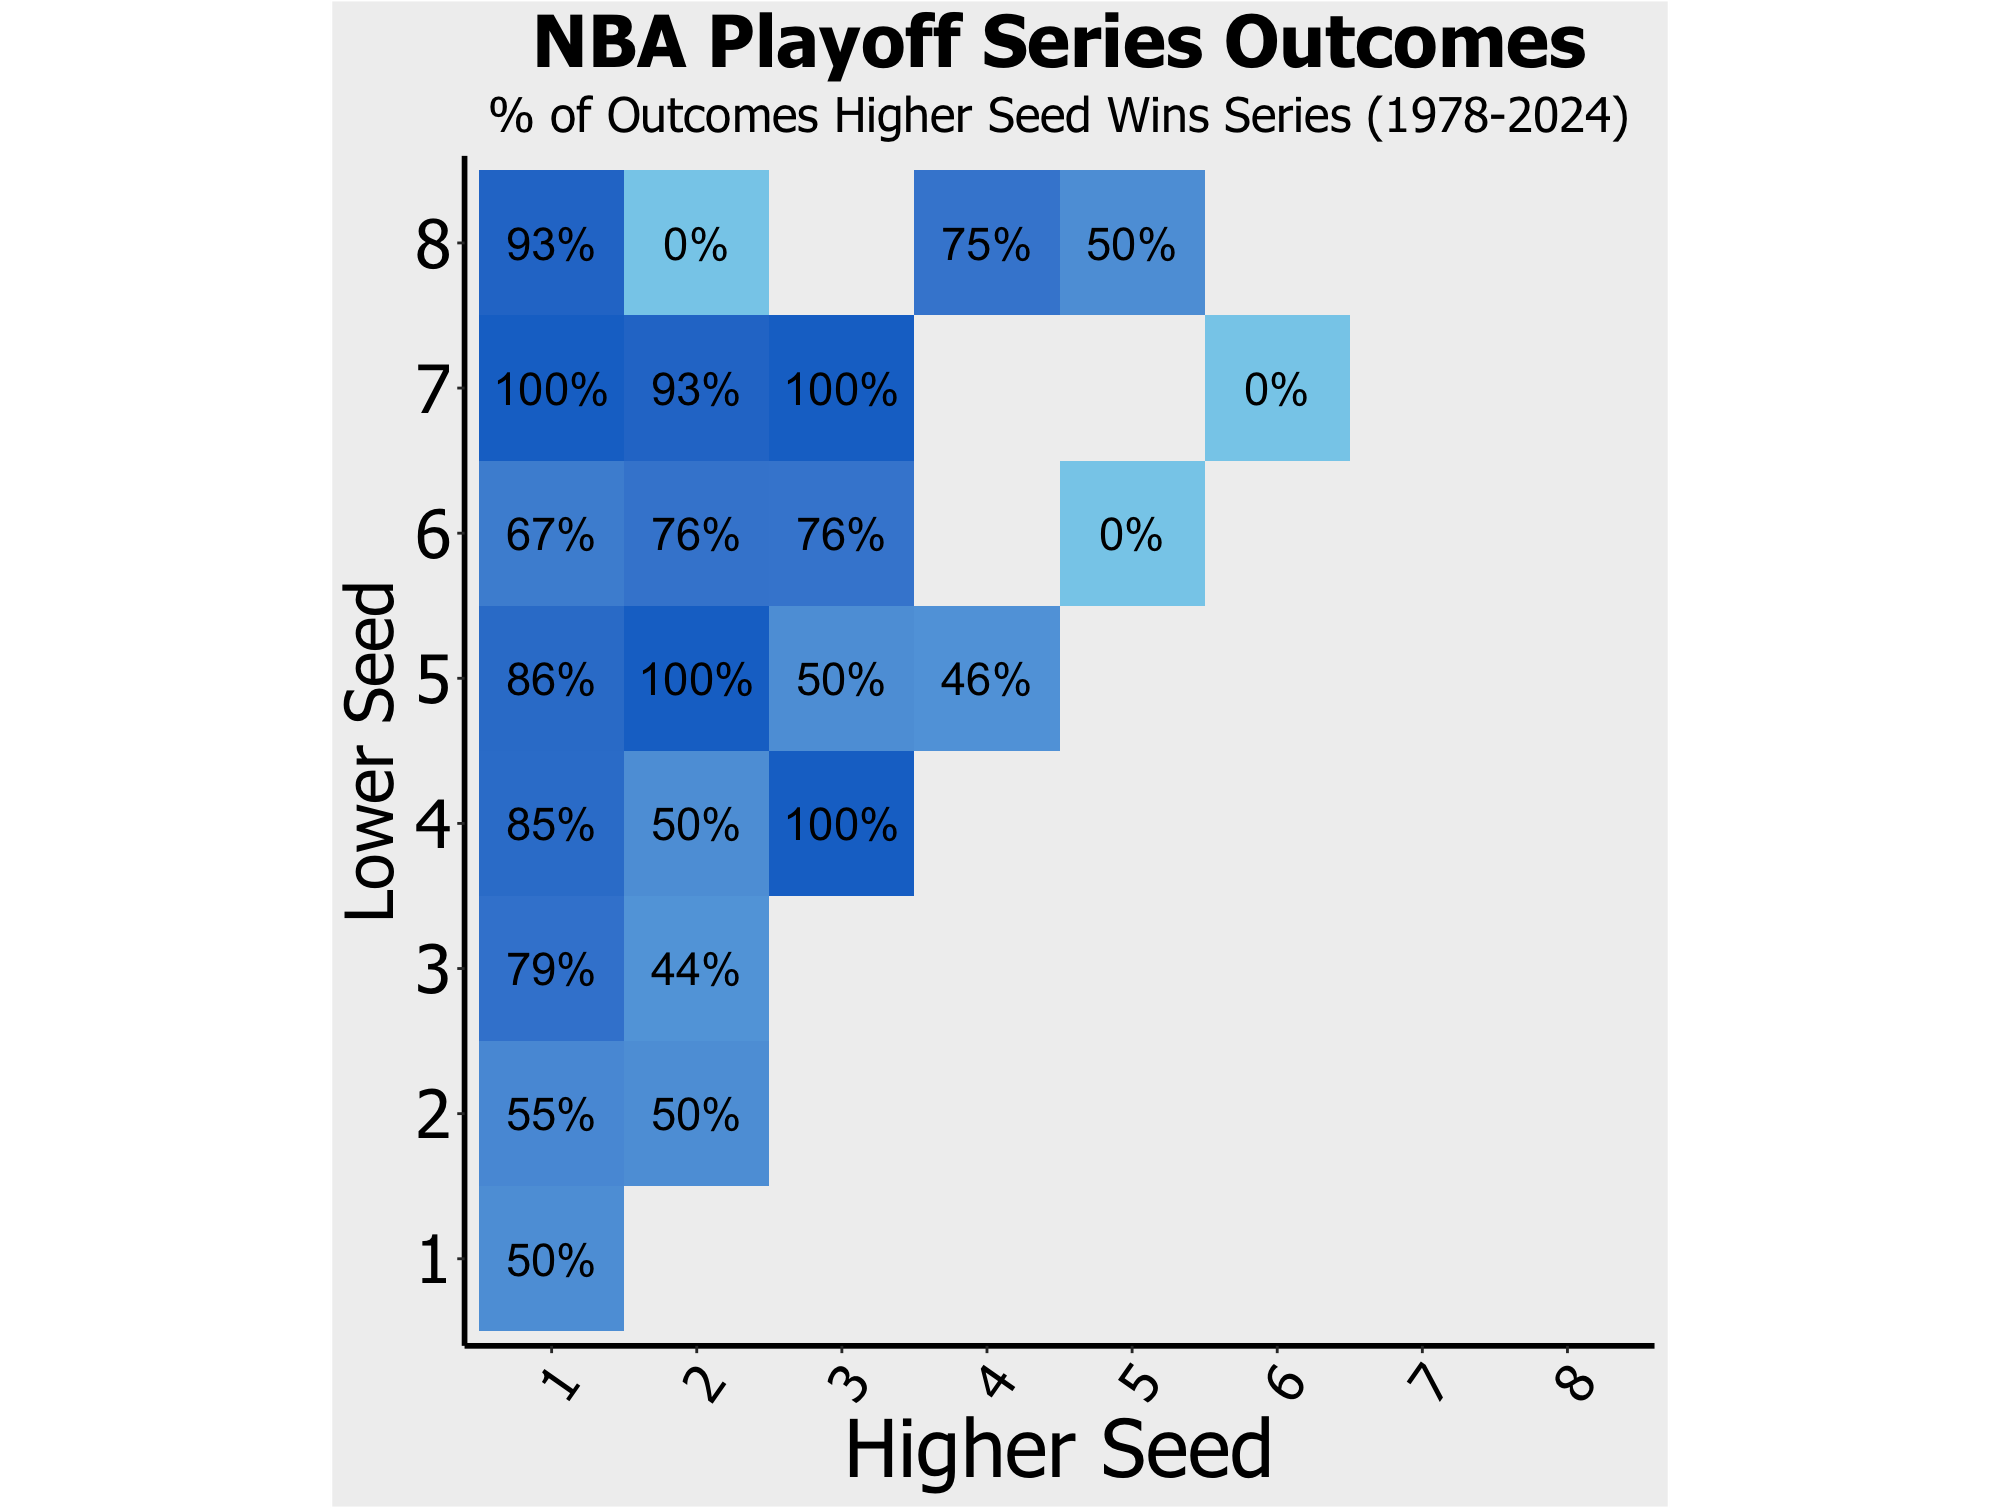
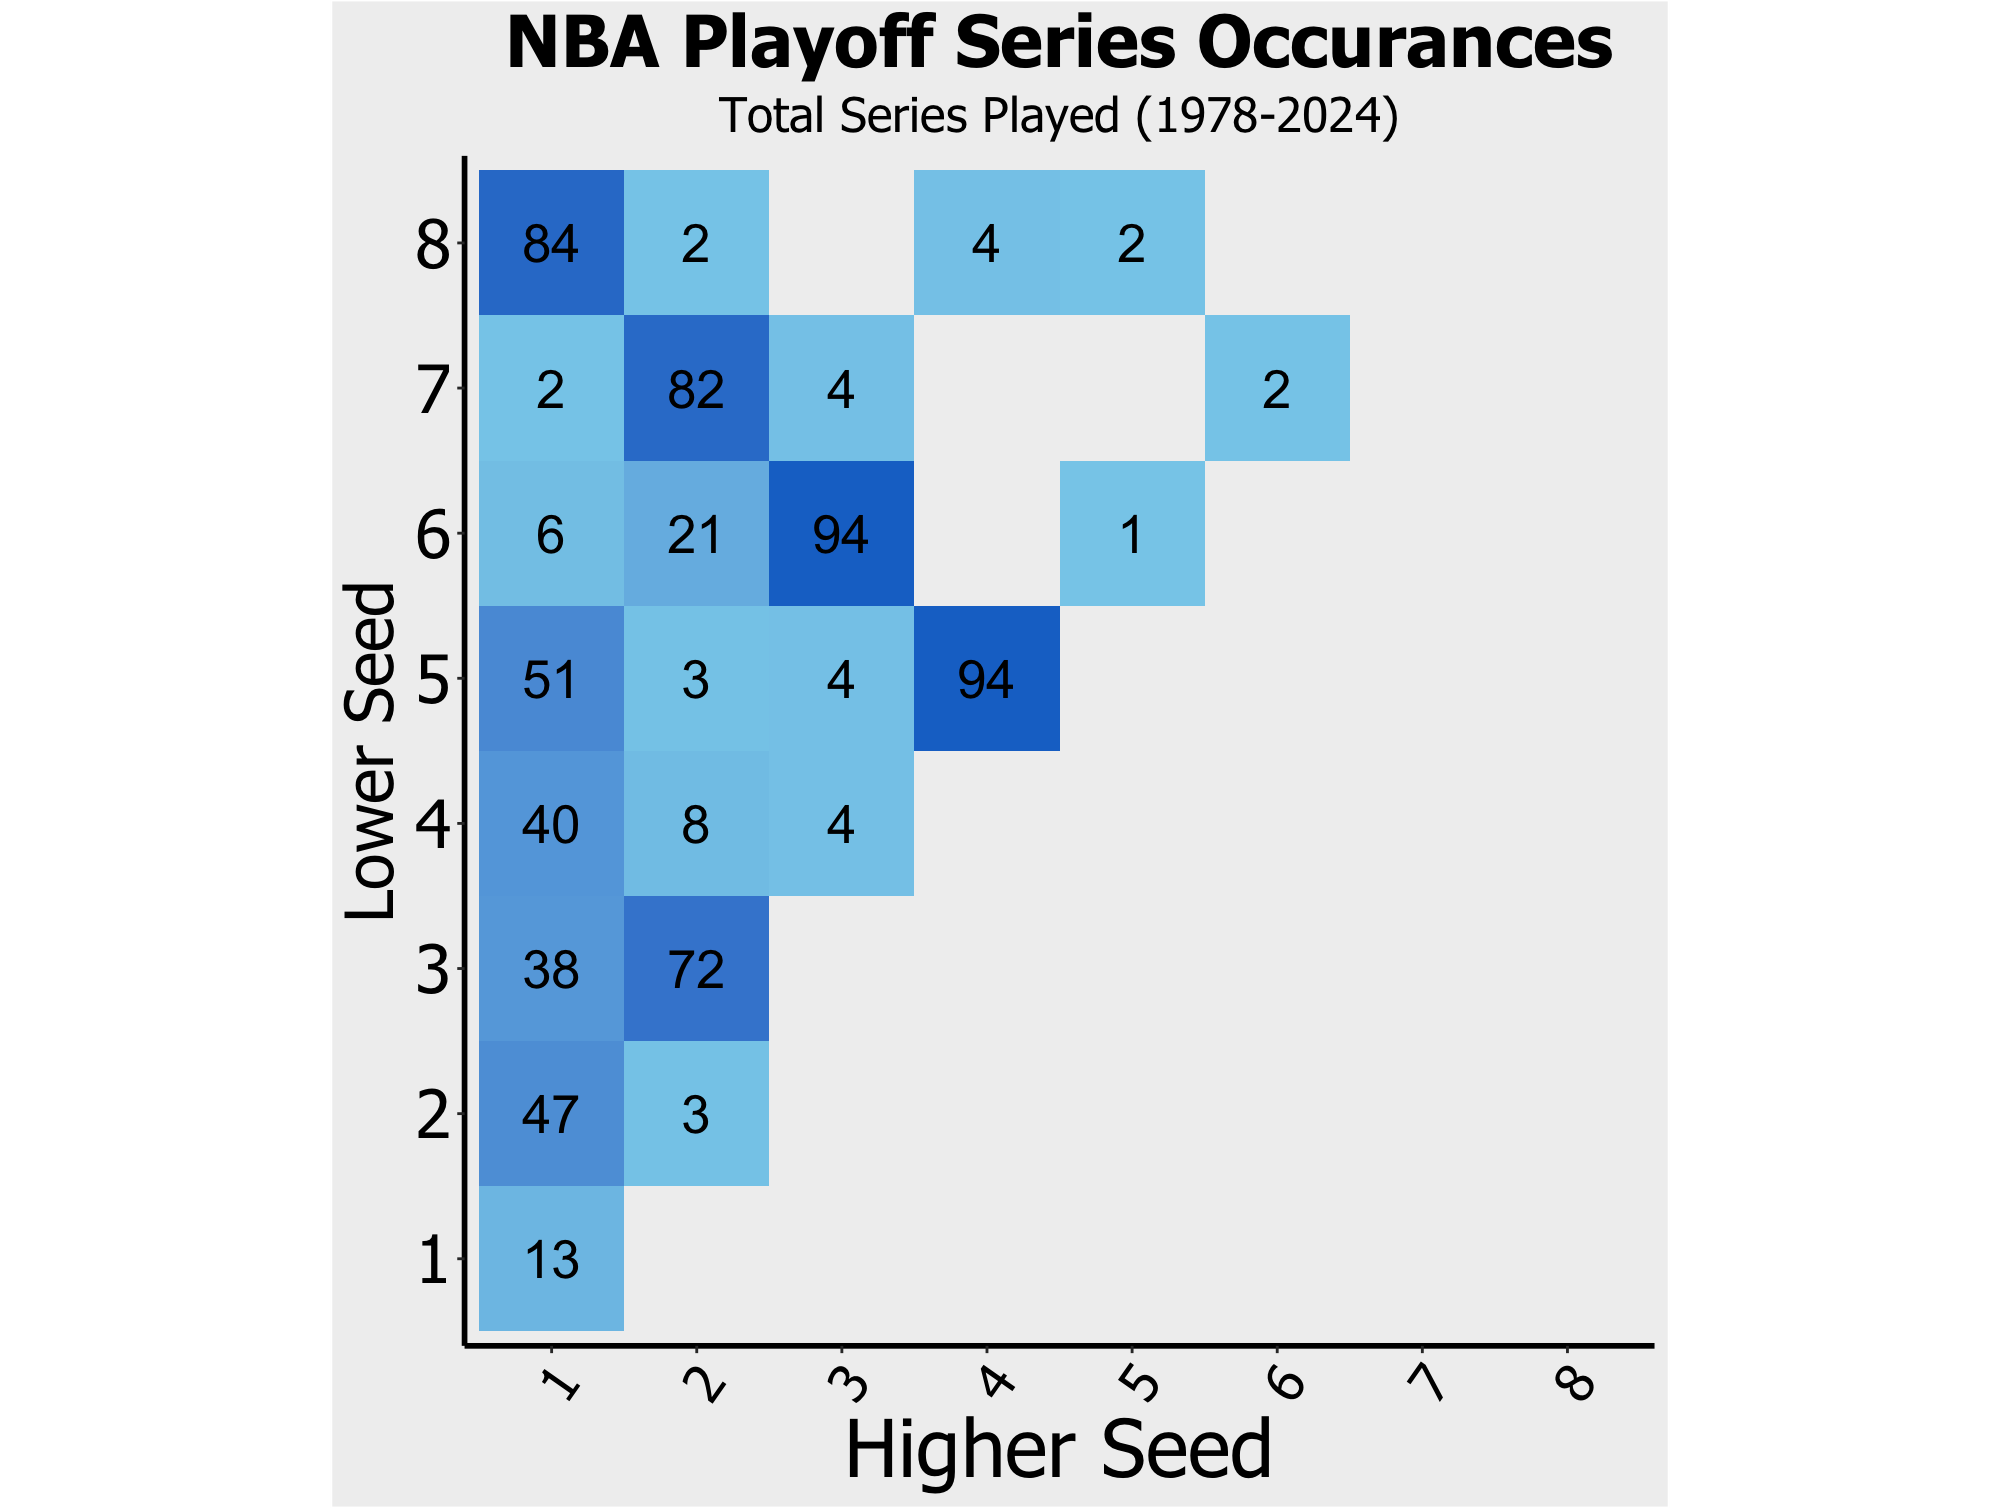
For the NBA, we start in 1978 when playoffs expanded from from 8 to 12 (currently 16 plus 4 play-in teams). 8 seeds have defeated the 1 seed 6 times (7%). Those 6 teams have gone on to a second round record of 2-4, and the 2 second round victories went on to 2-0 in the conference finals (both against 2 seeds). These Cinderella 8 seeds, the 2023 Heat and the 1999 Knicks, advanced to the finals only to lose to Western Conference 1 seeds, the Spurs and Nuggets respectively.
Also noteworthy is that in the 5 vs 4 match up, the 5 seed has come out on top in 54% of series and of the 8 times a conference finals featured a 4 vs 2, both seeds split 4 series each.
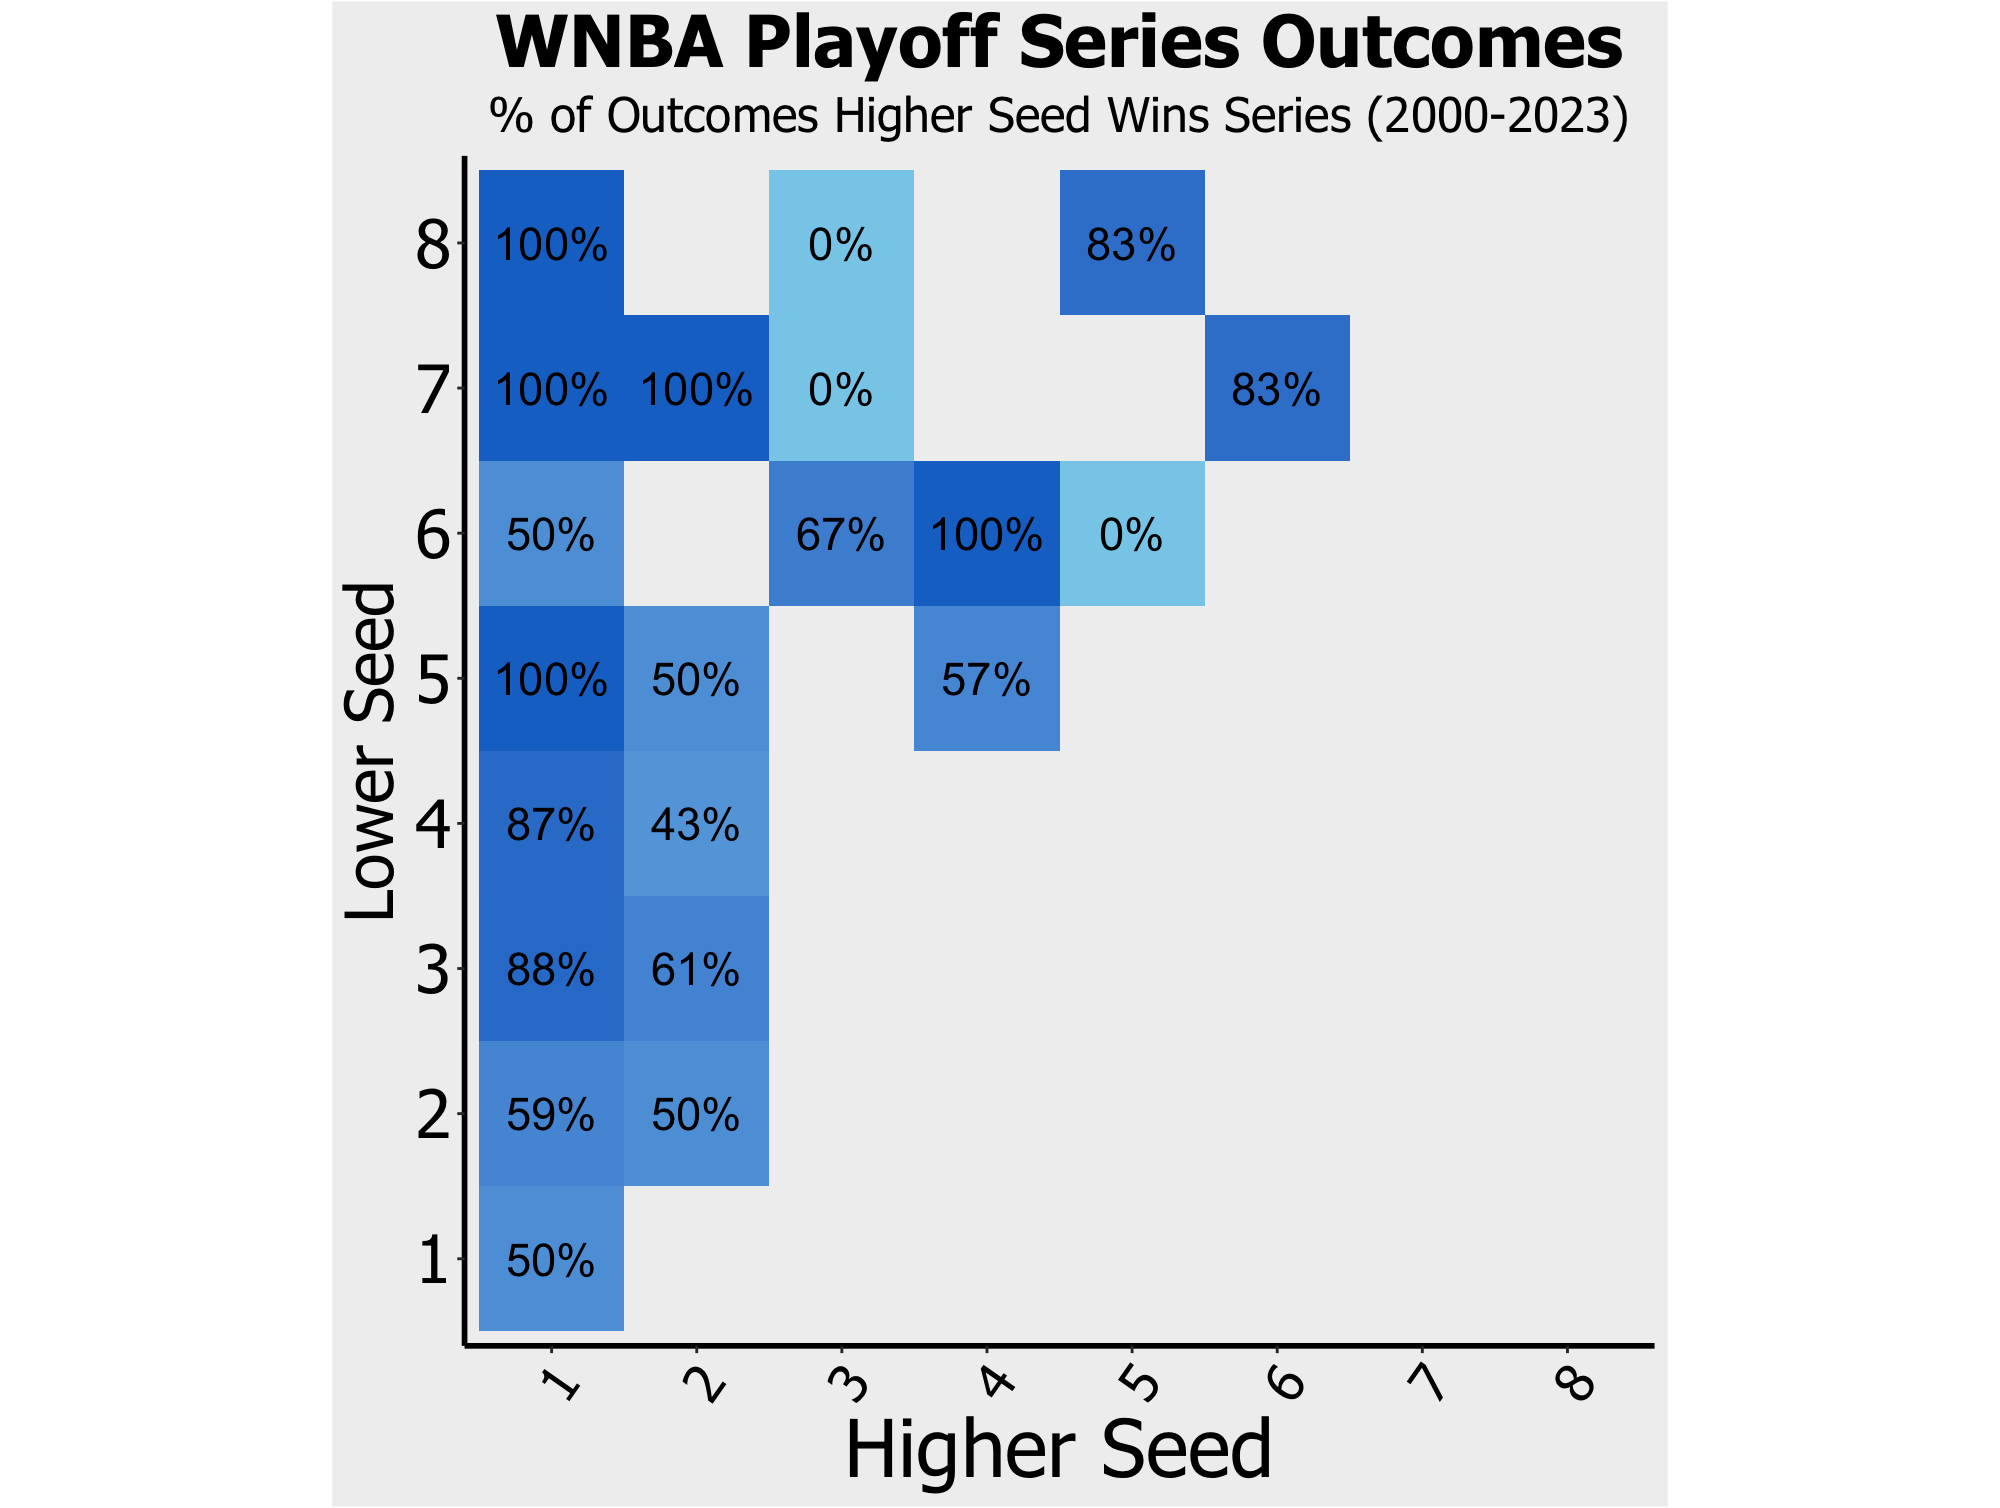
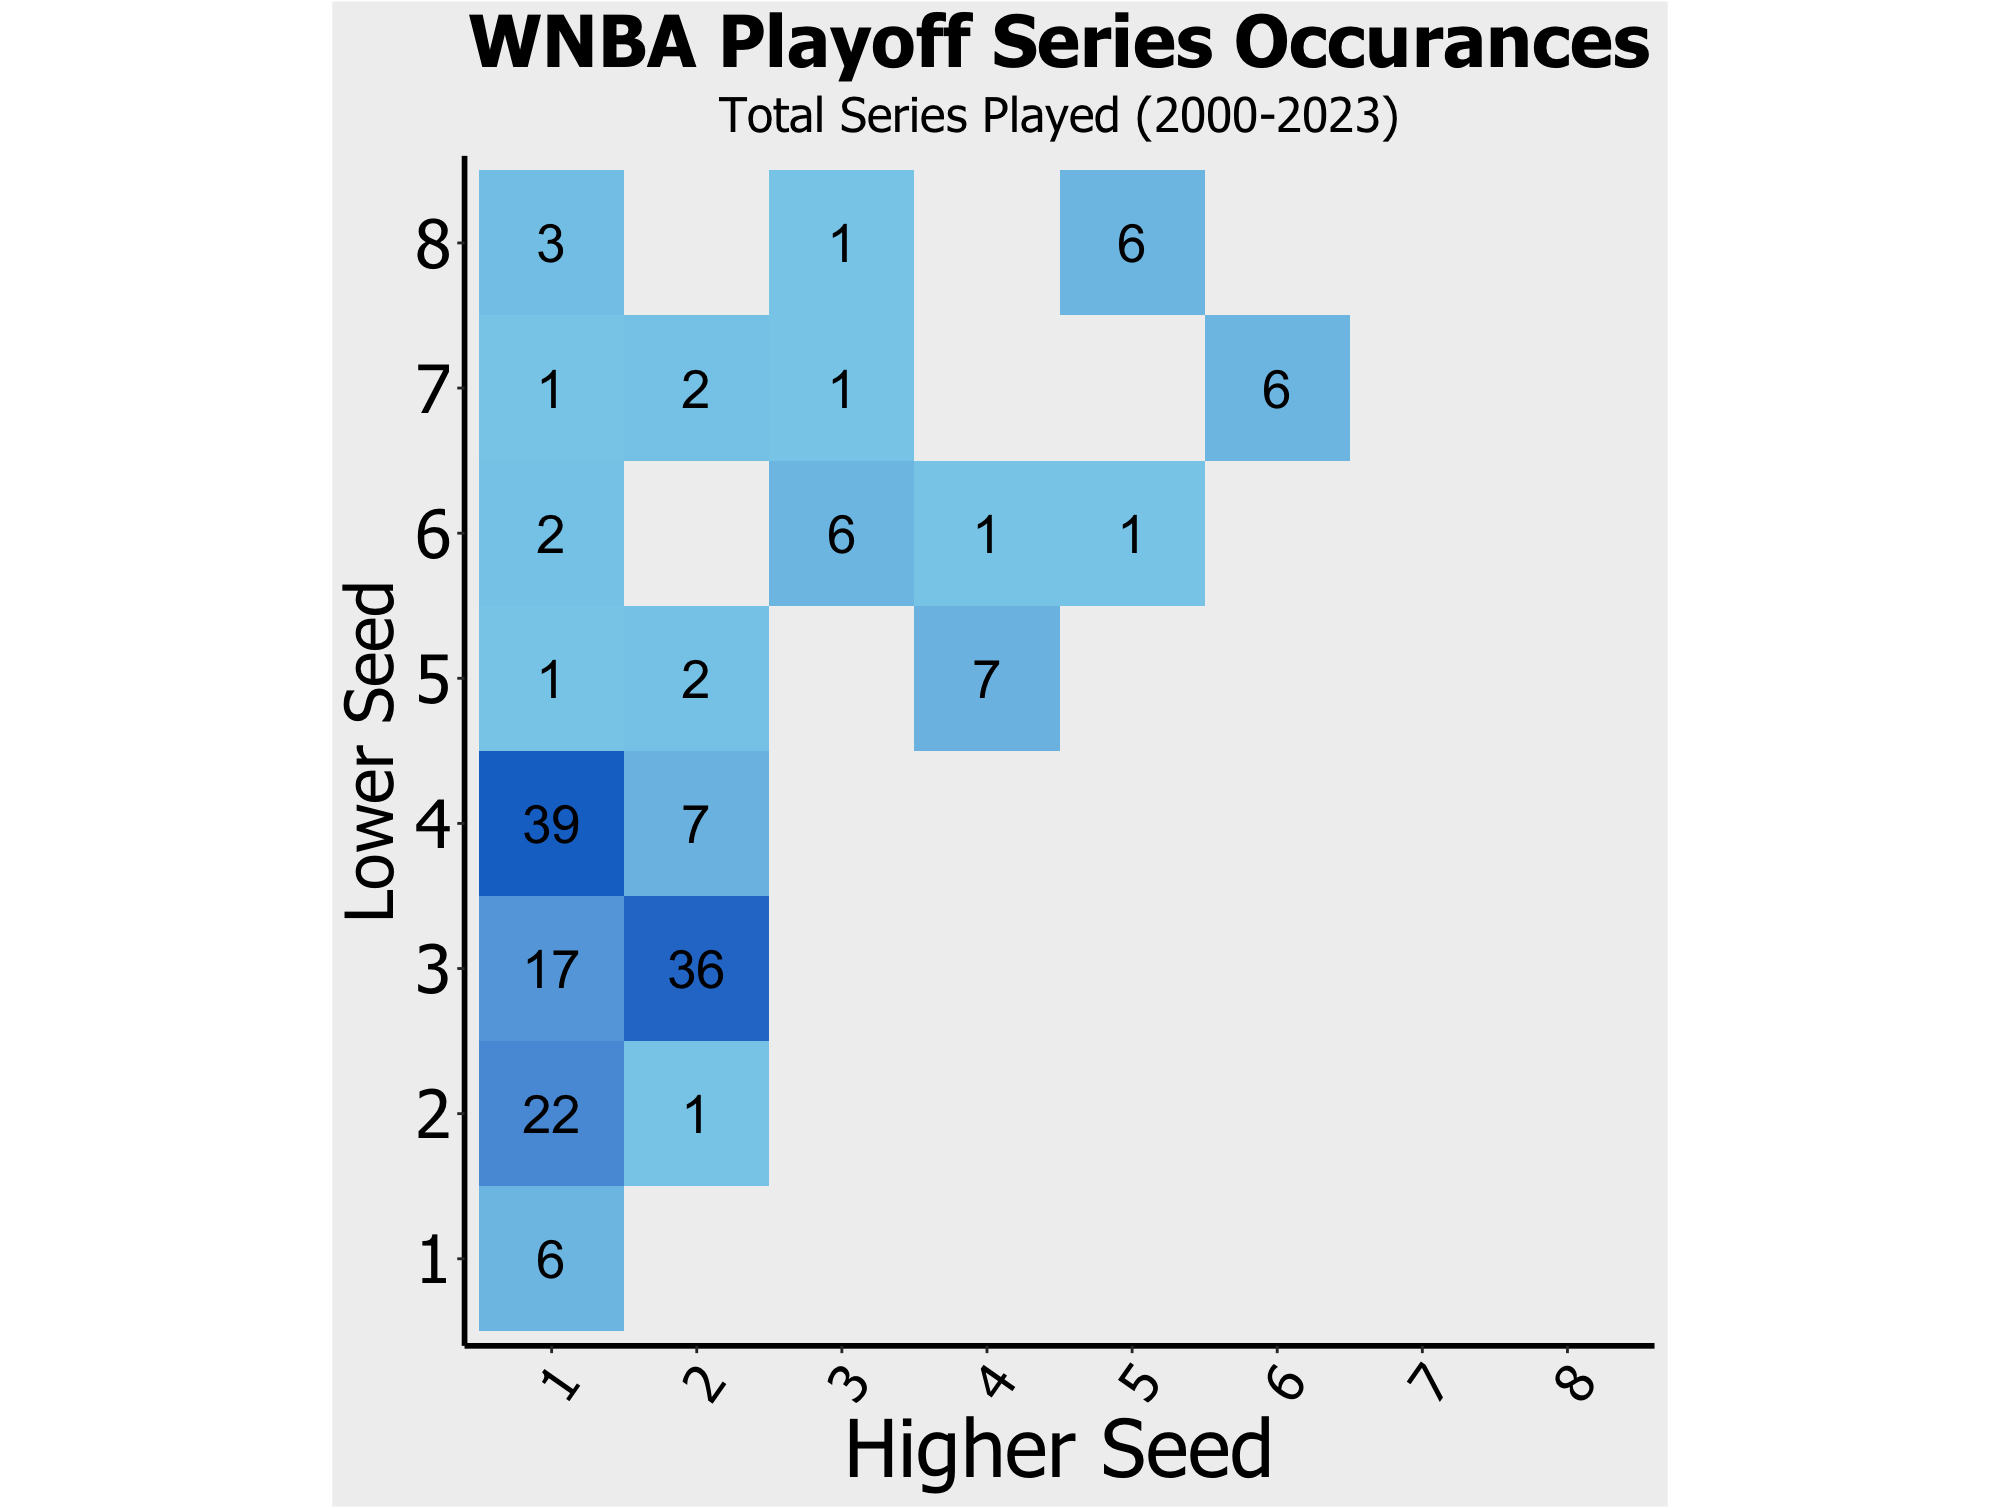
The inaugural WNBA season was in 1997, but in 2000 the league first expanded to an 8 team playoff. Even more so than the NBA, 1 seeds have historically dominated the playoff bracket. Other than the 2021 Chicago Sky (6 seed) all champions have been either a 1 or 2. It’s not uncommon for 3 through 6 seeds to make the finals, however, as 19% of conference finals have sent a team lower than a 2 seed to the finals, including the 5 seeded Mercury that lost to the Sky in 2021.
The noteworthy common upset here is the 4 vs 2 match up, which we’ve also seen especially close in other sports. However in this case, the 4 triumphs over the 2 in 57% of series.
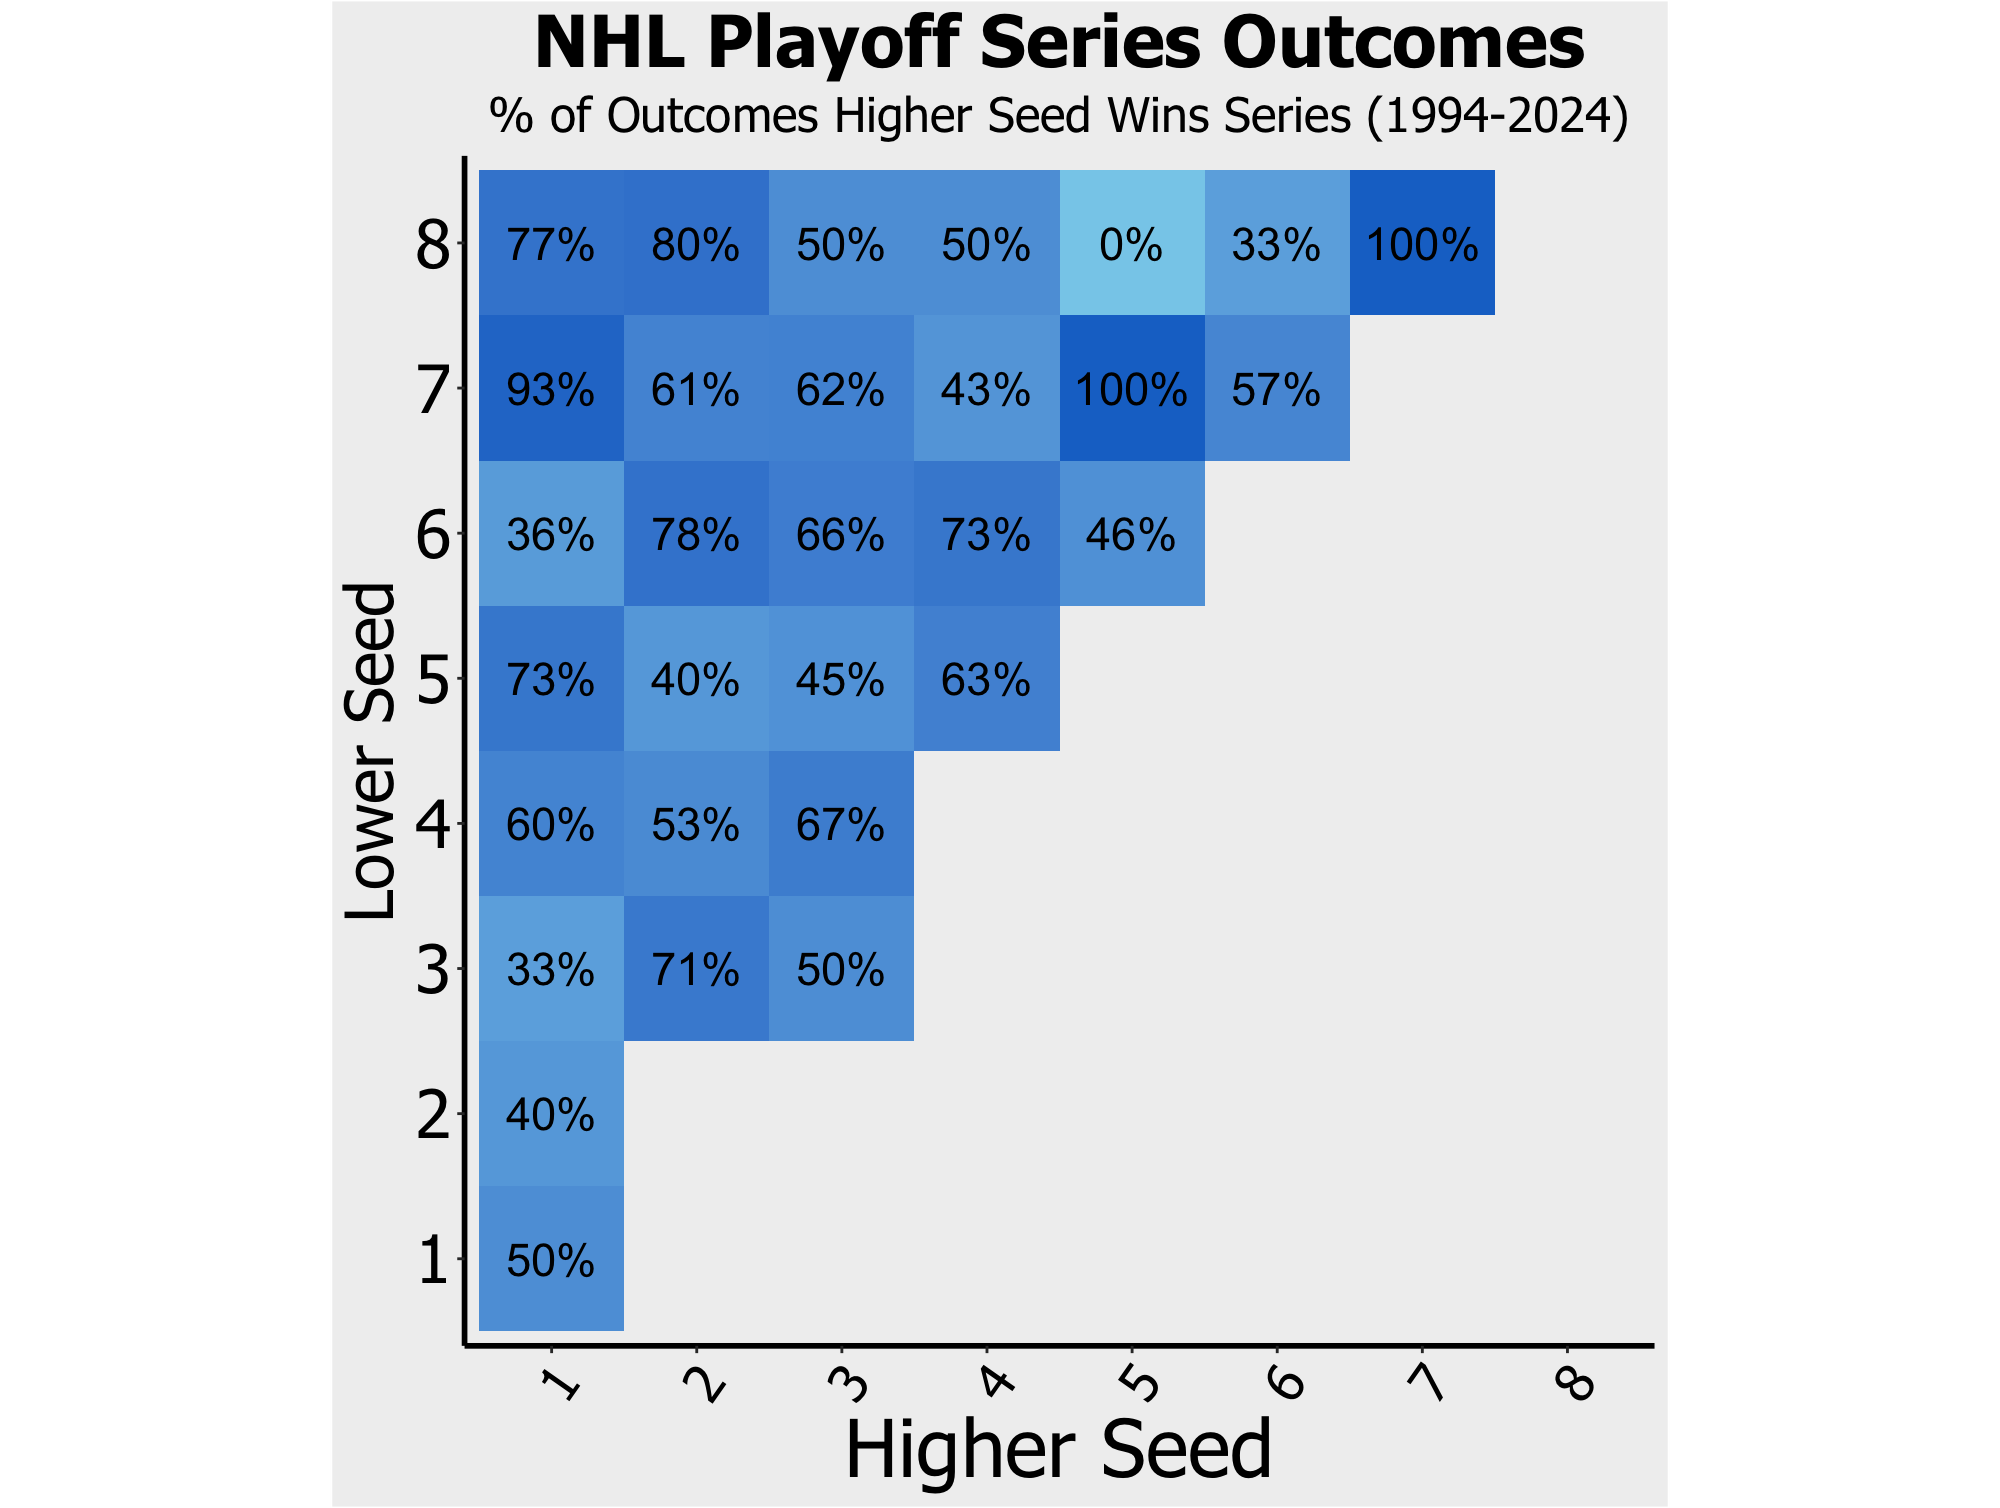
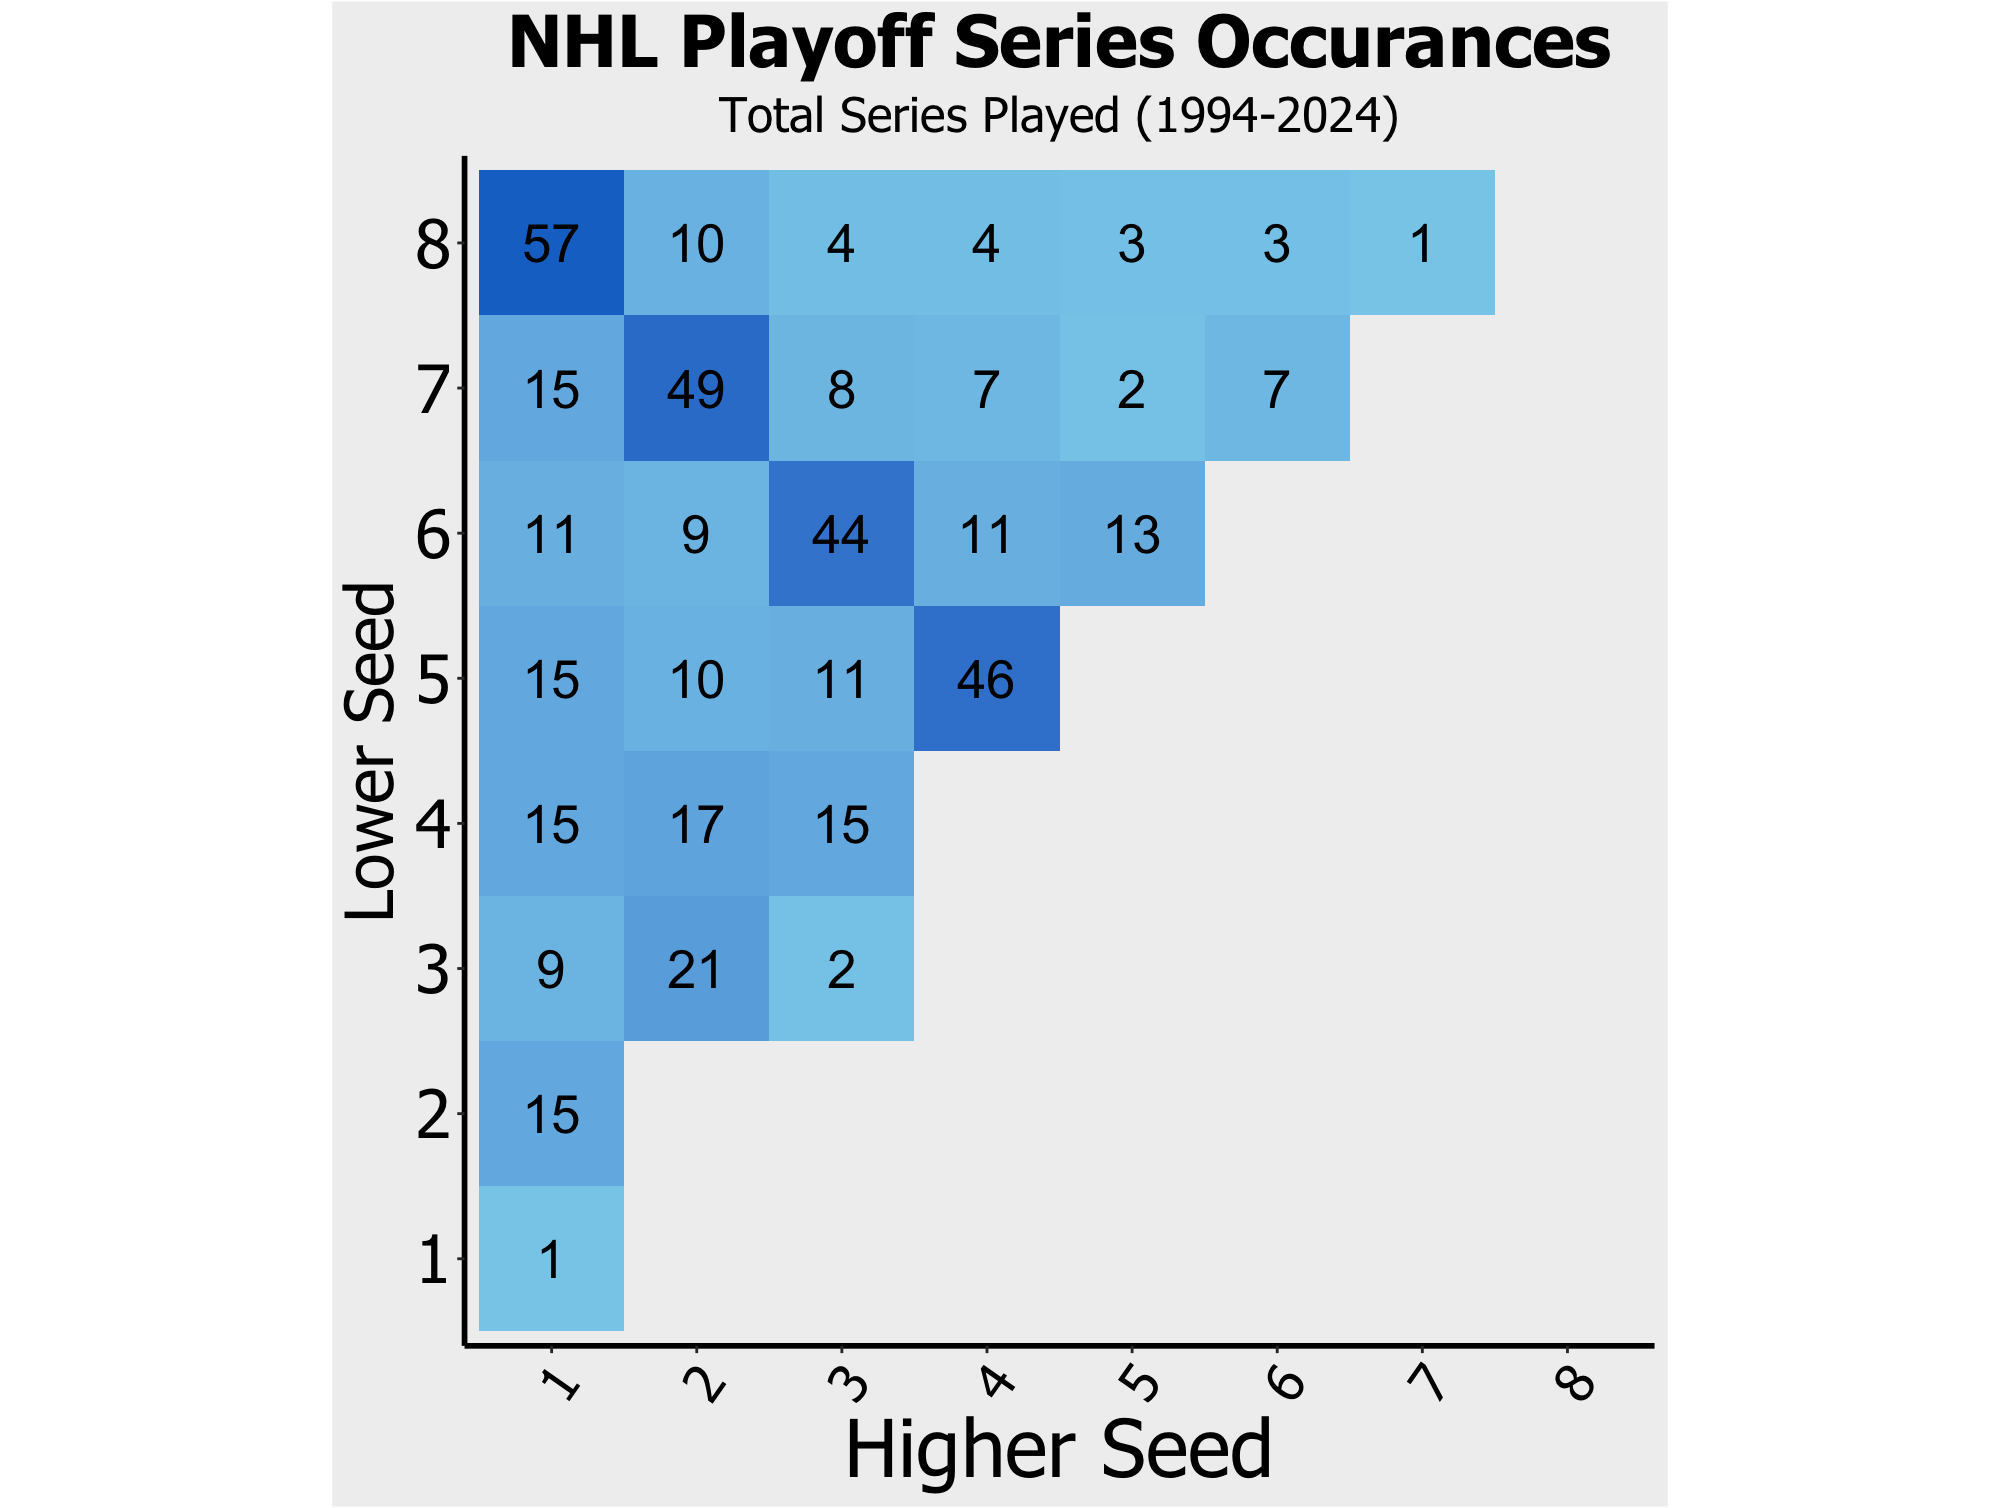
In 1994, the NHL switched from division oriented playoffs to conference oriented, but the current format as of 2014 is back to division led. While the current playoff format doesn’t technically have traditional 1 through 8 seeds in each conference, for the purpose of this analysis, we seed each team based on regular season point totals respective to their conference. The NHL format also leaves for a lot of nontraditional seeding match ups, and the heat map below shows how chaotic the Stanley Cup playoffs can be.
More often than not we see 2s, 3s and 6s beating 1s, 5s beating 2s, 3s and 7s beating 4s, and 8s beating 6s. If there is any pattern to the Stanley Cup playoffs, it’s difficult to detect with data. Every seed except 7 has won the Stanley Cup at least once, and all 8 seeds have made the Stanley Cup multiple times.
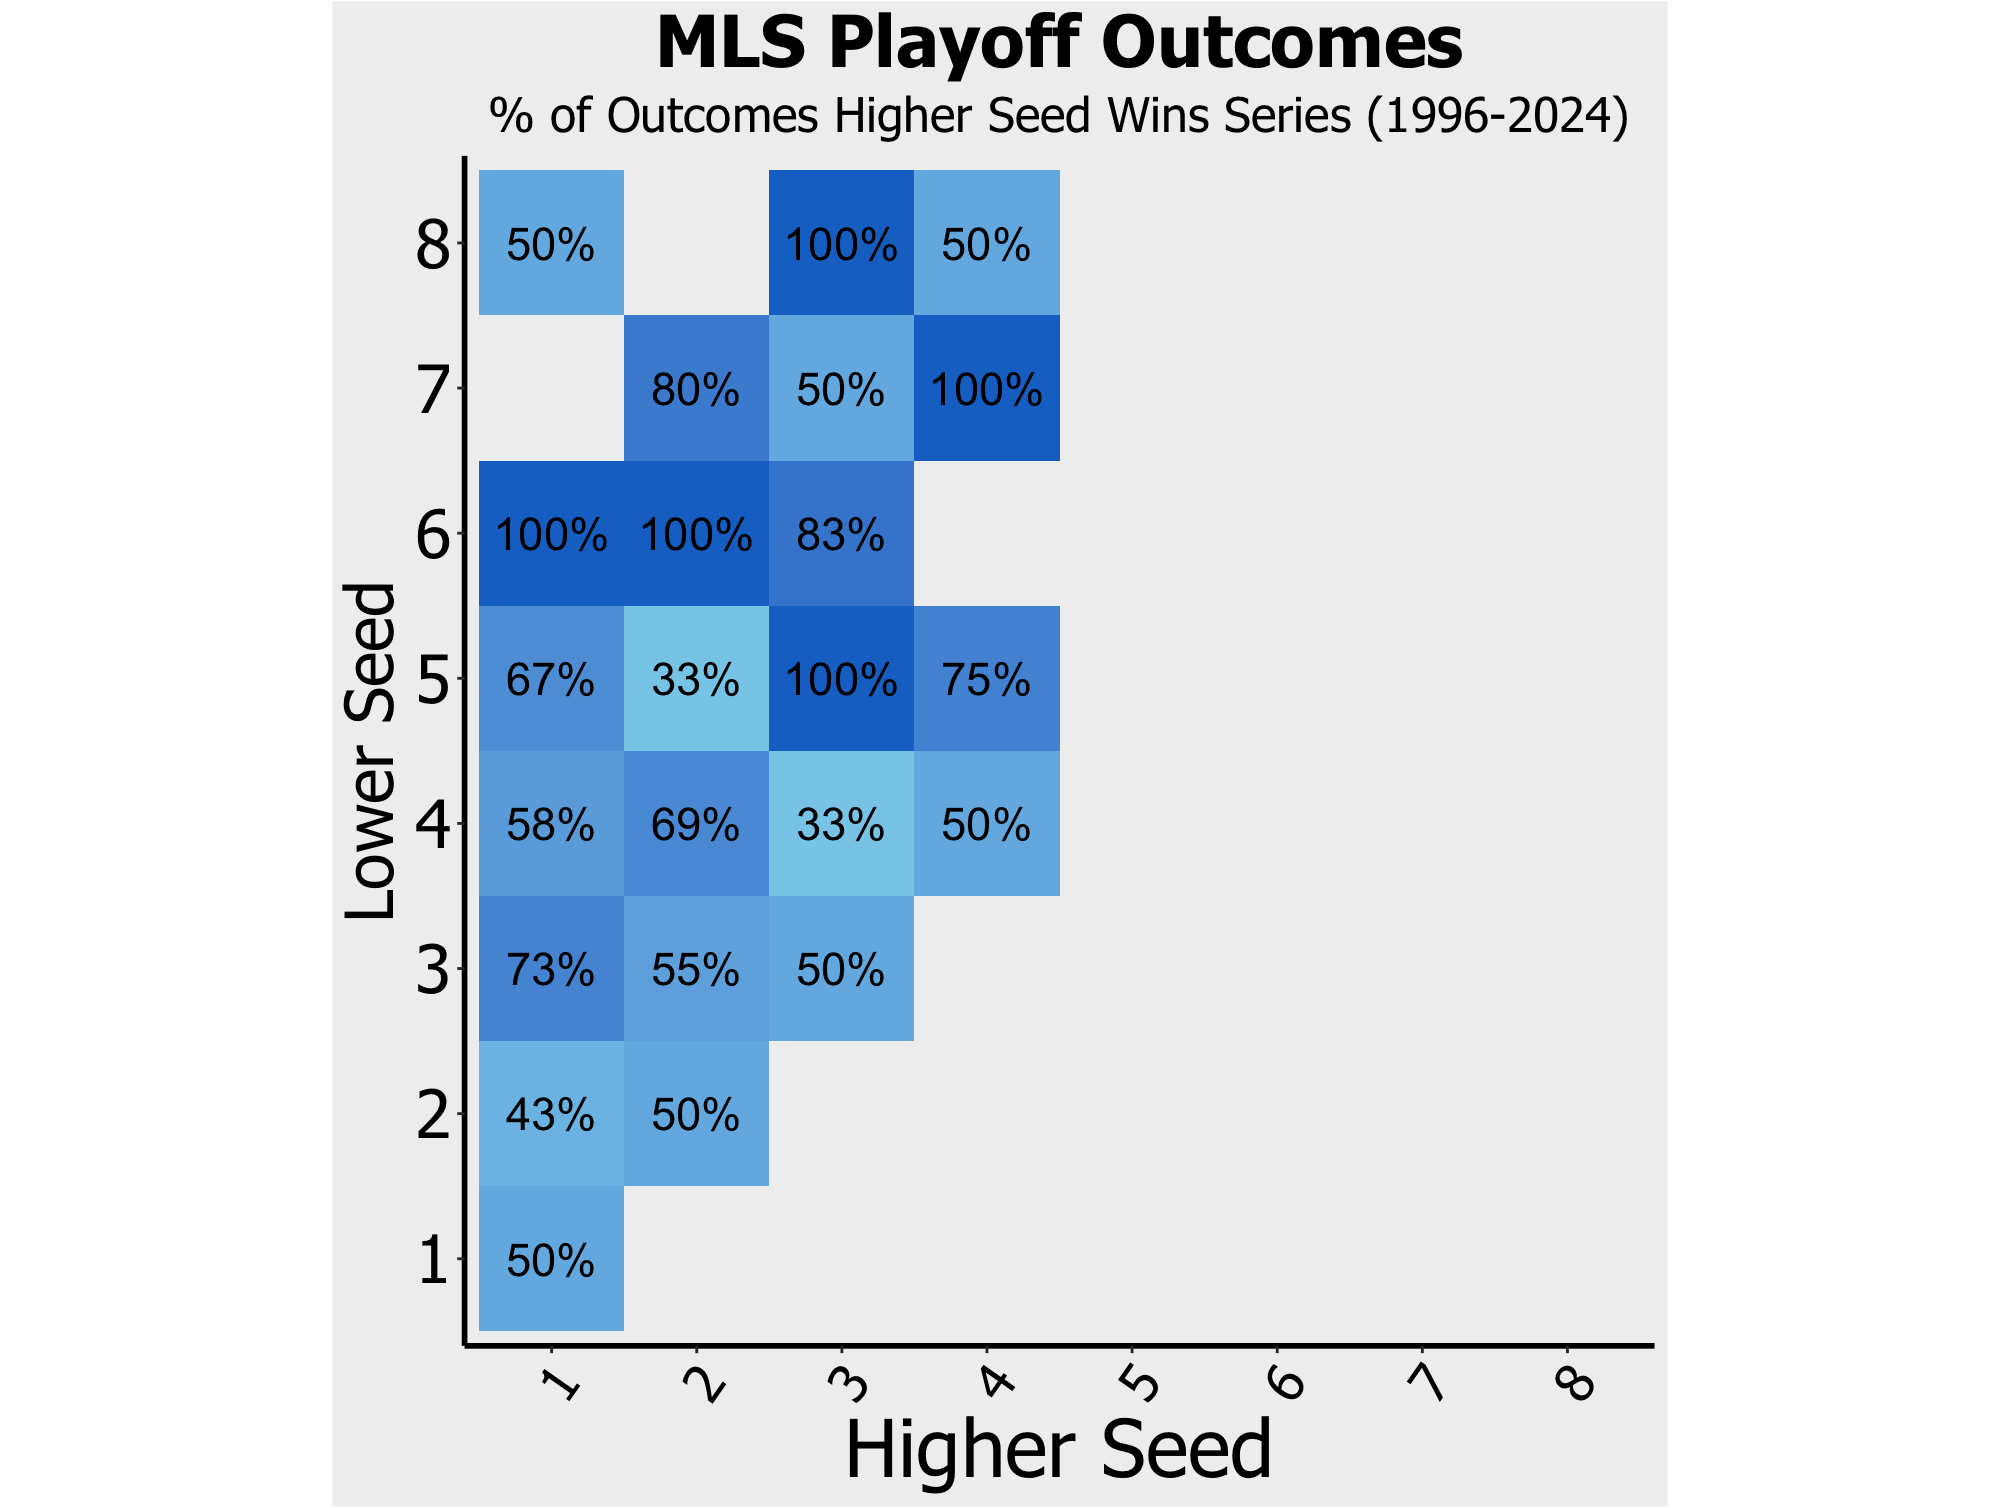
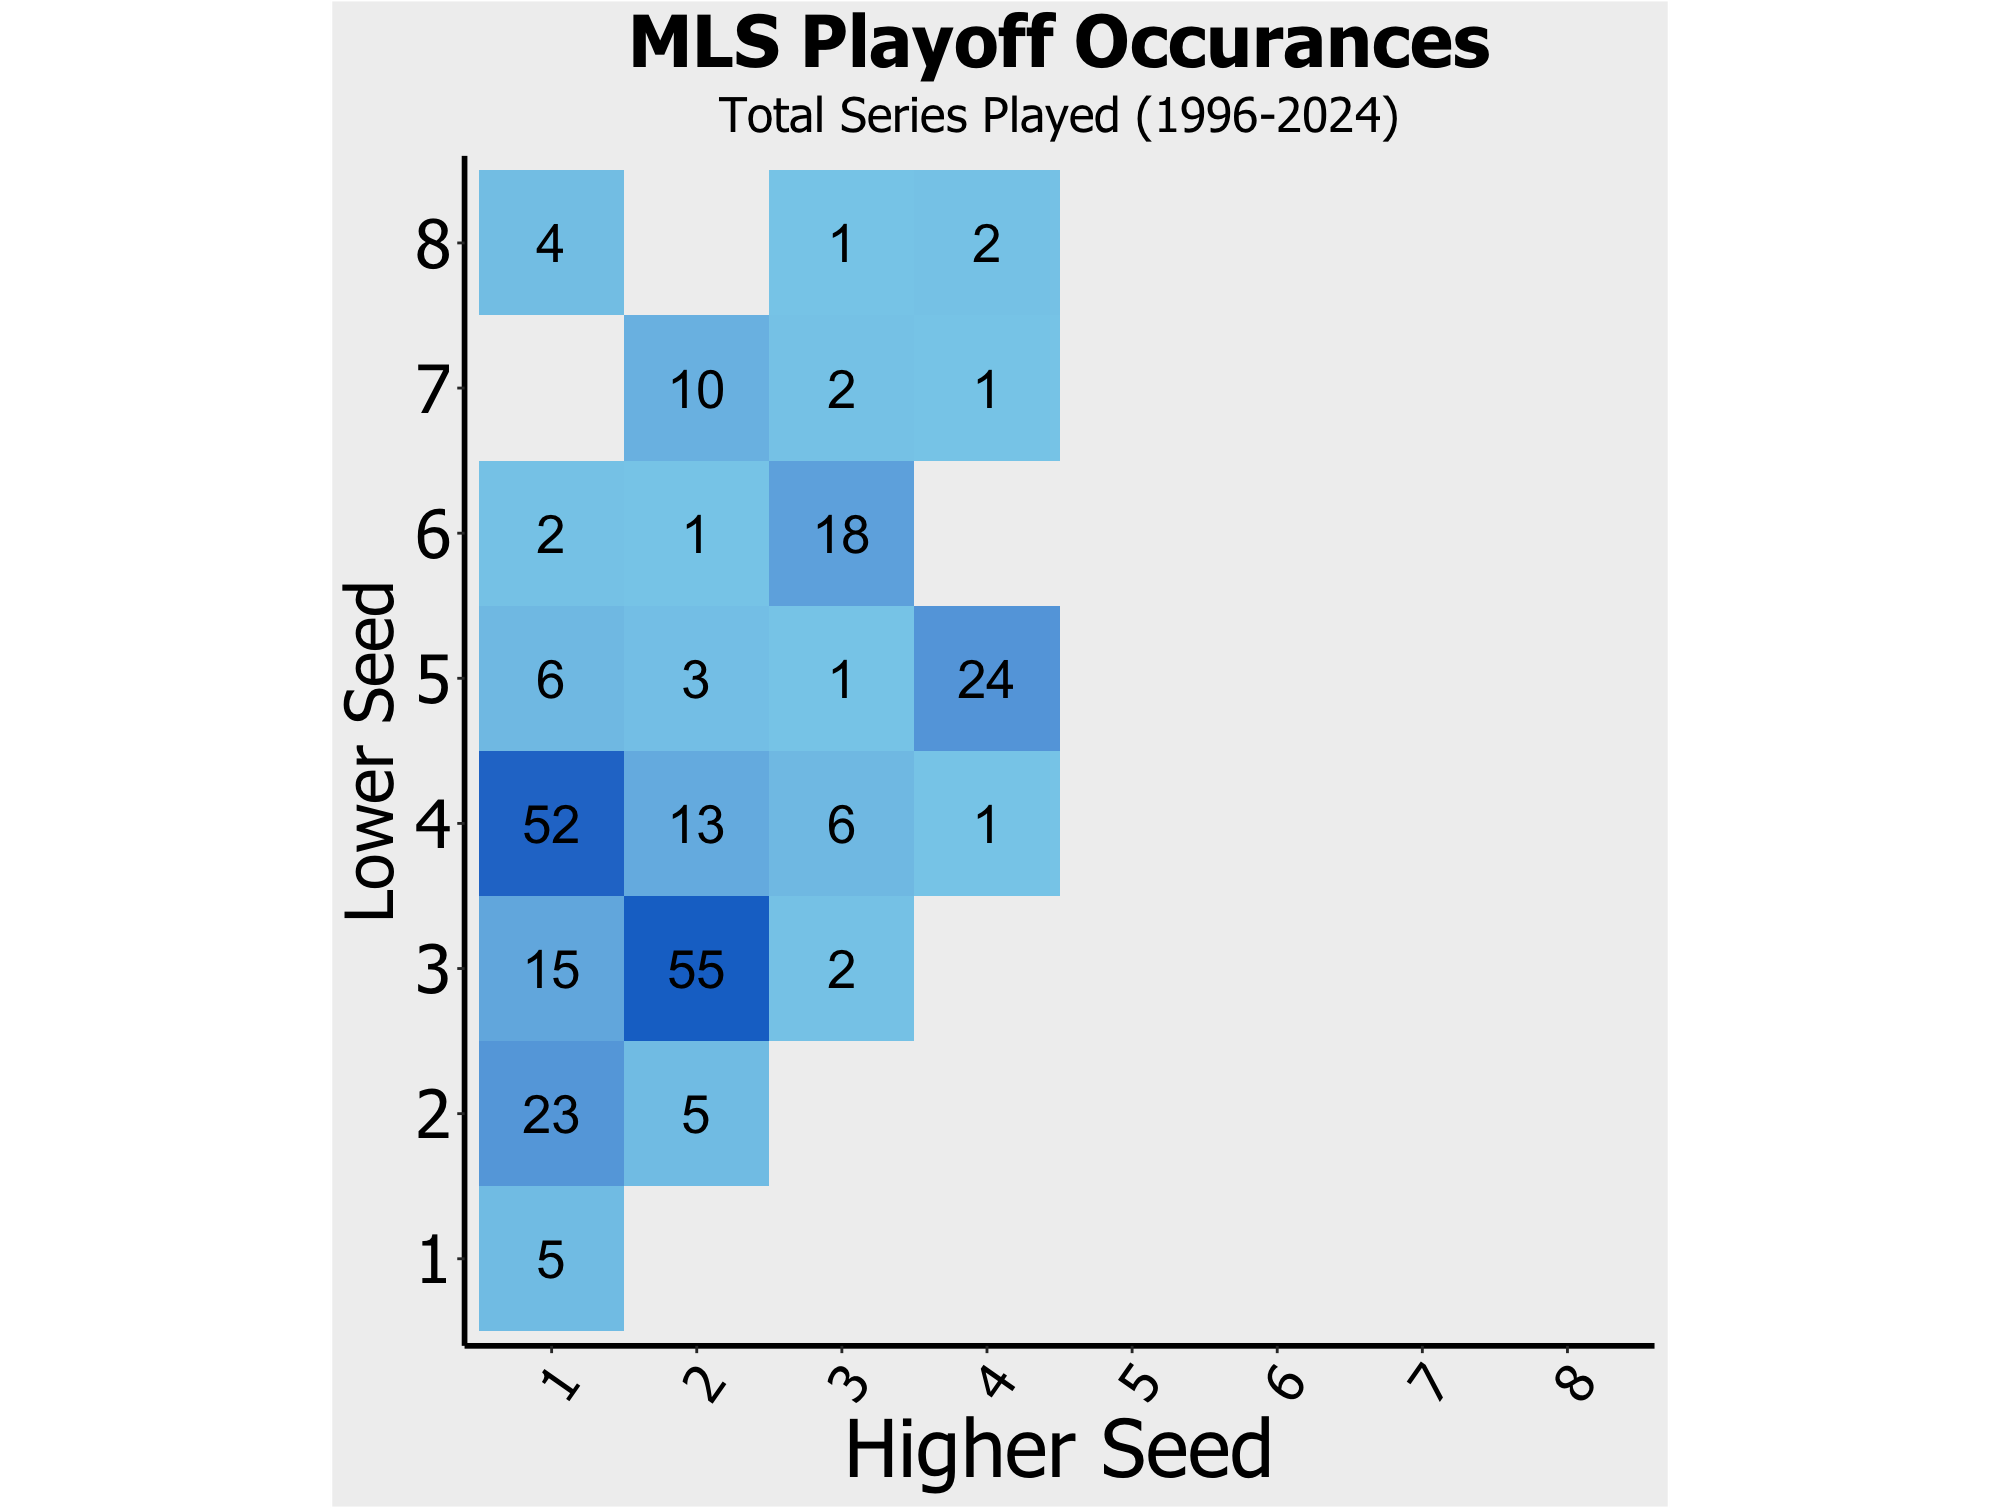
Lastly we look at soccer, starting with the MLS, which had its inaugural season in 1996. After the single-match 8 vs 9 wildcard games and the best of three series of round 1, the final 8 teams play a single-elimination tournament. With each round up for grabs in just 90 minutes, 3 of the last 4 MLS champions were a 3 or 4 seed, most recently the 2023 Columbus Crew topping another 3 seed, LAFC. Having expanded from 12 to 16 playoff teams in 2020, the 8 seed is an impressive 3-4 (2-2 vs 1 seeds). 1 seeds are also just 10-13 vs 2 seeds and 30-22 against 4 seeds. Despite not having won the Cup since 2014, the LA Galaxy have the most championships at 5 (9 appearances).
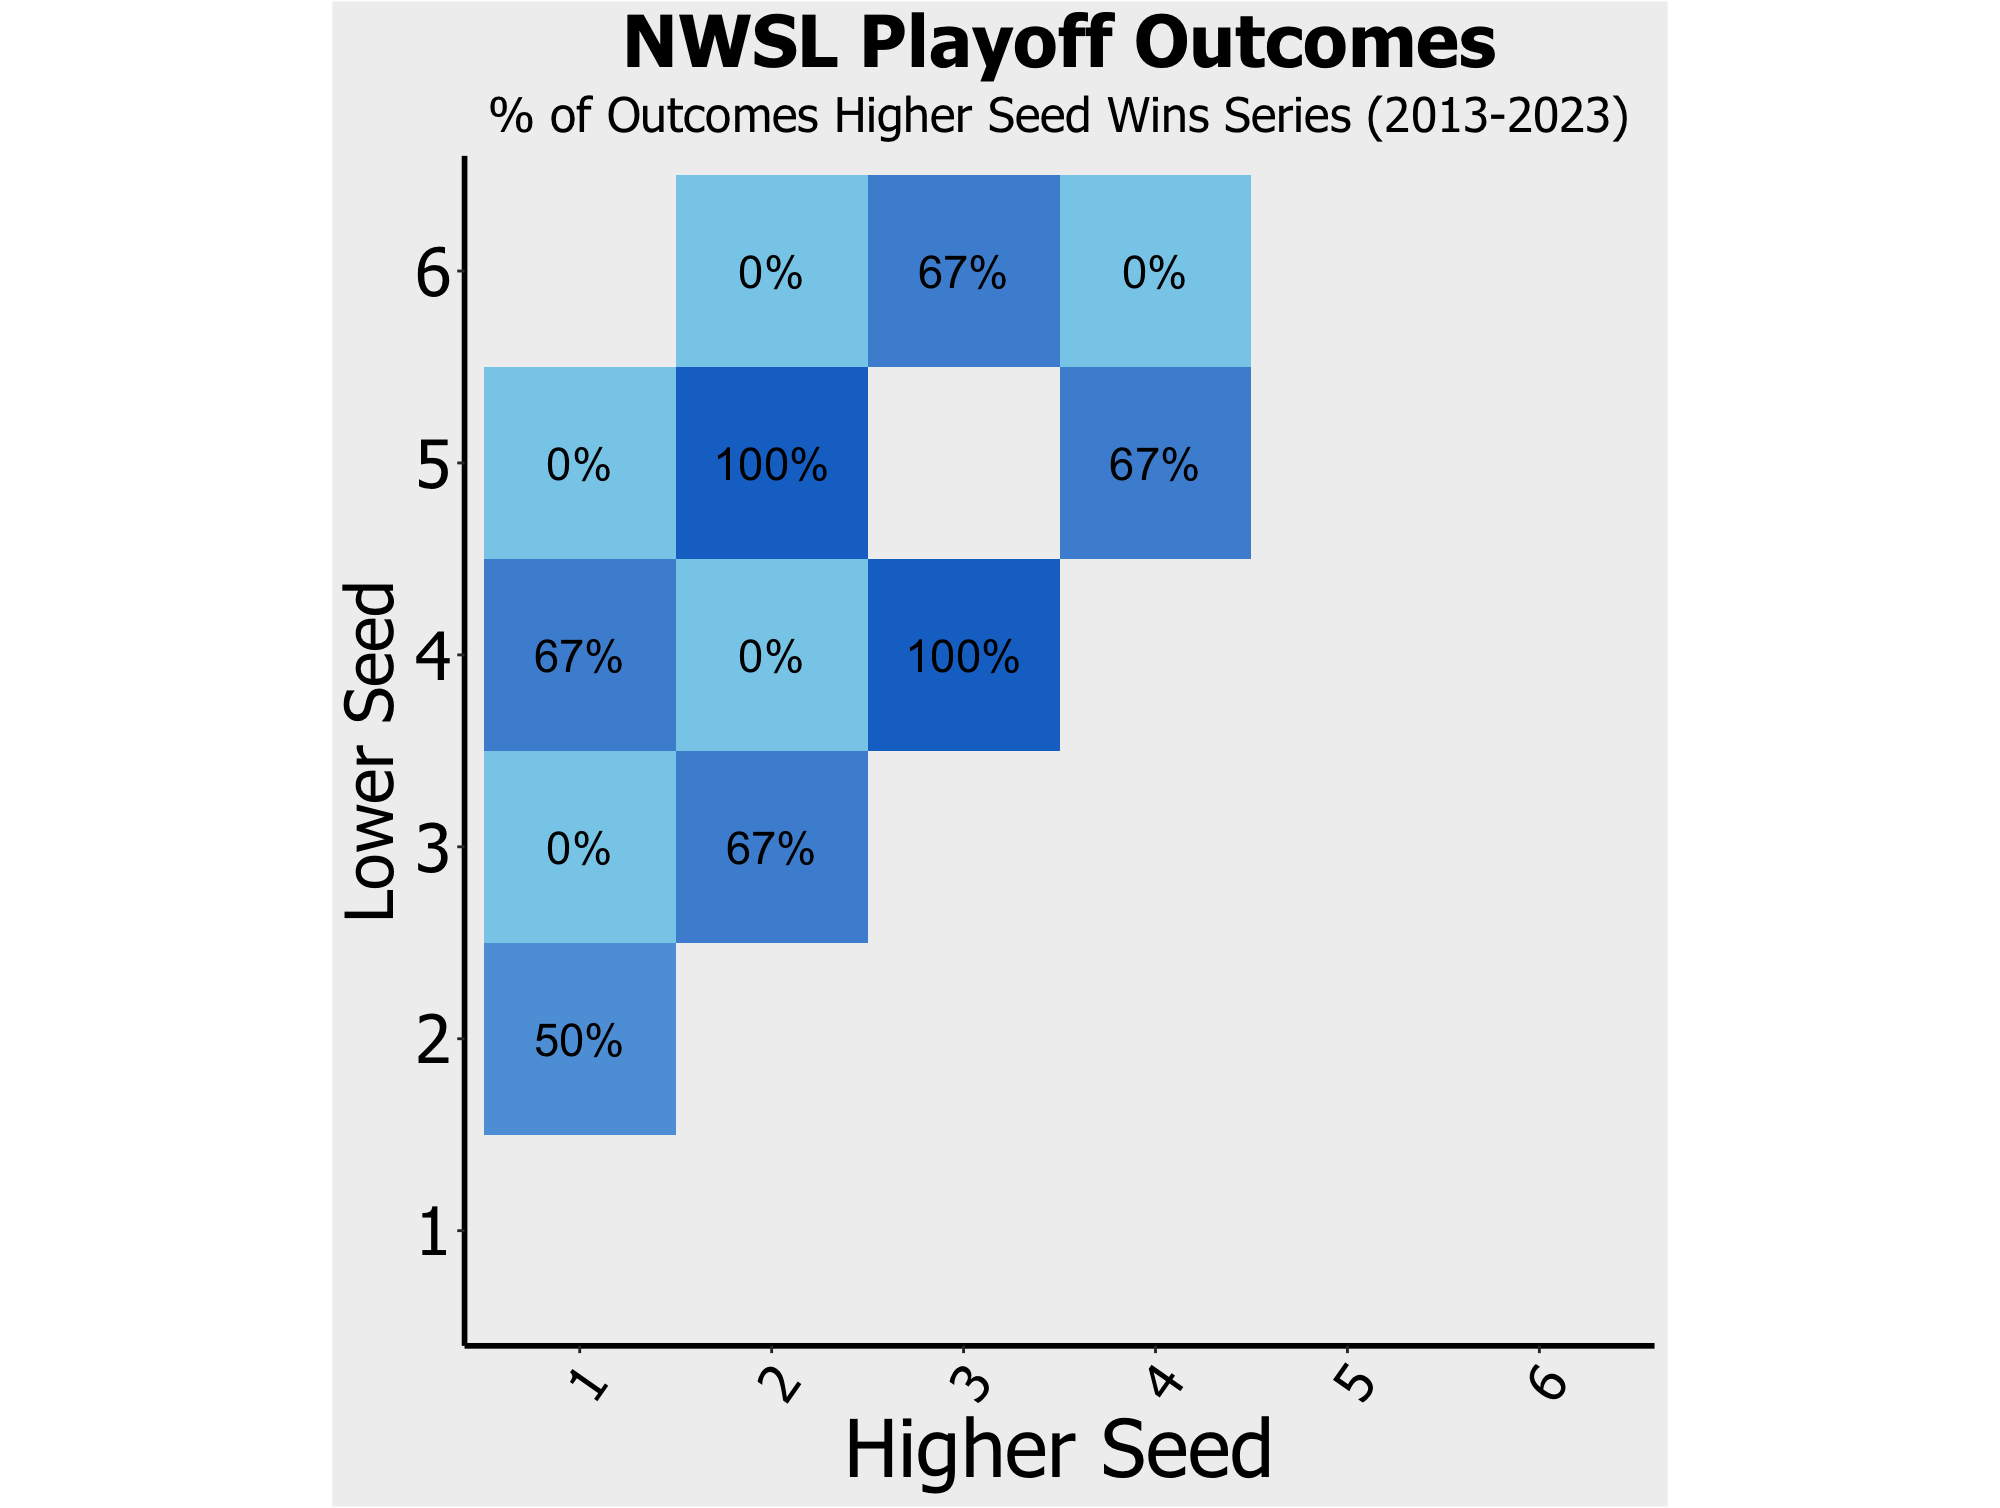
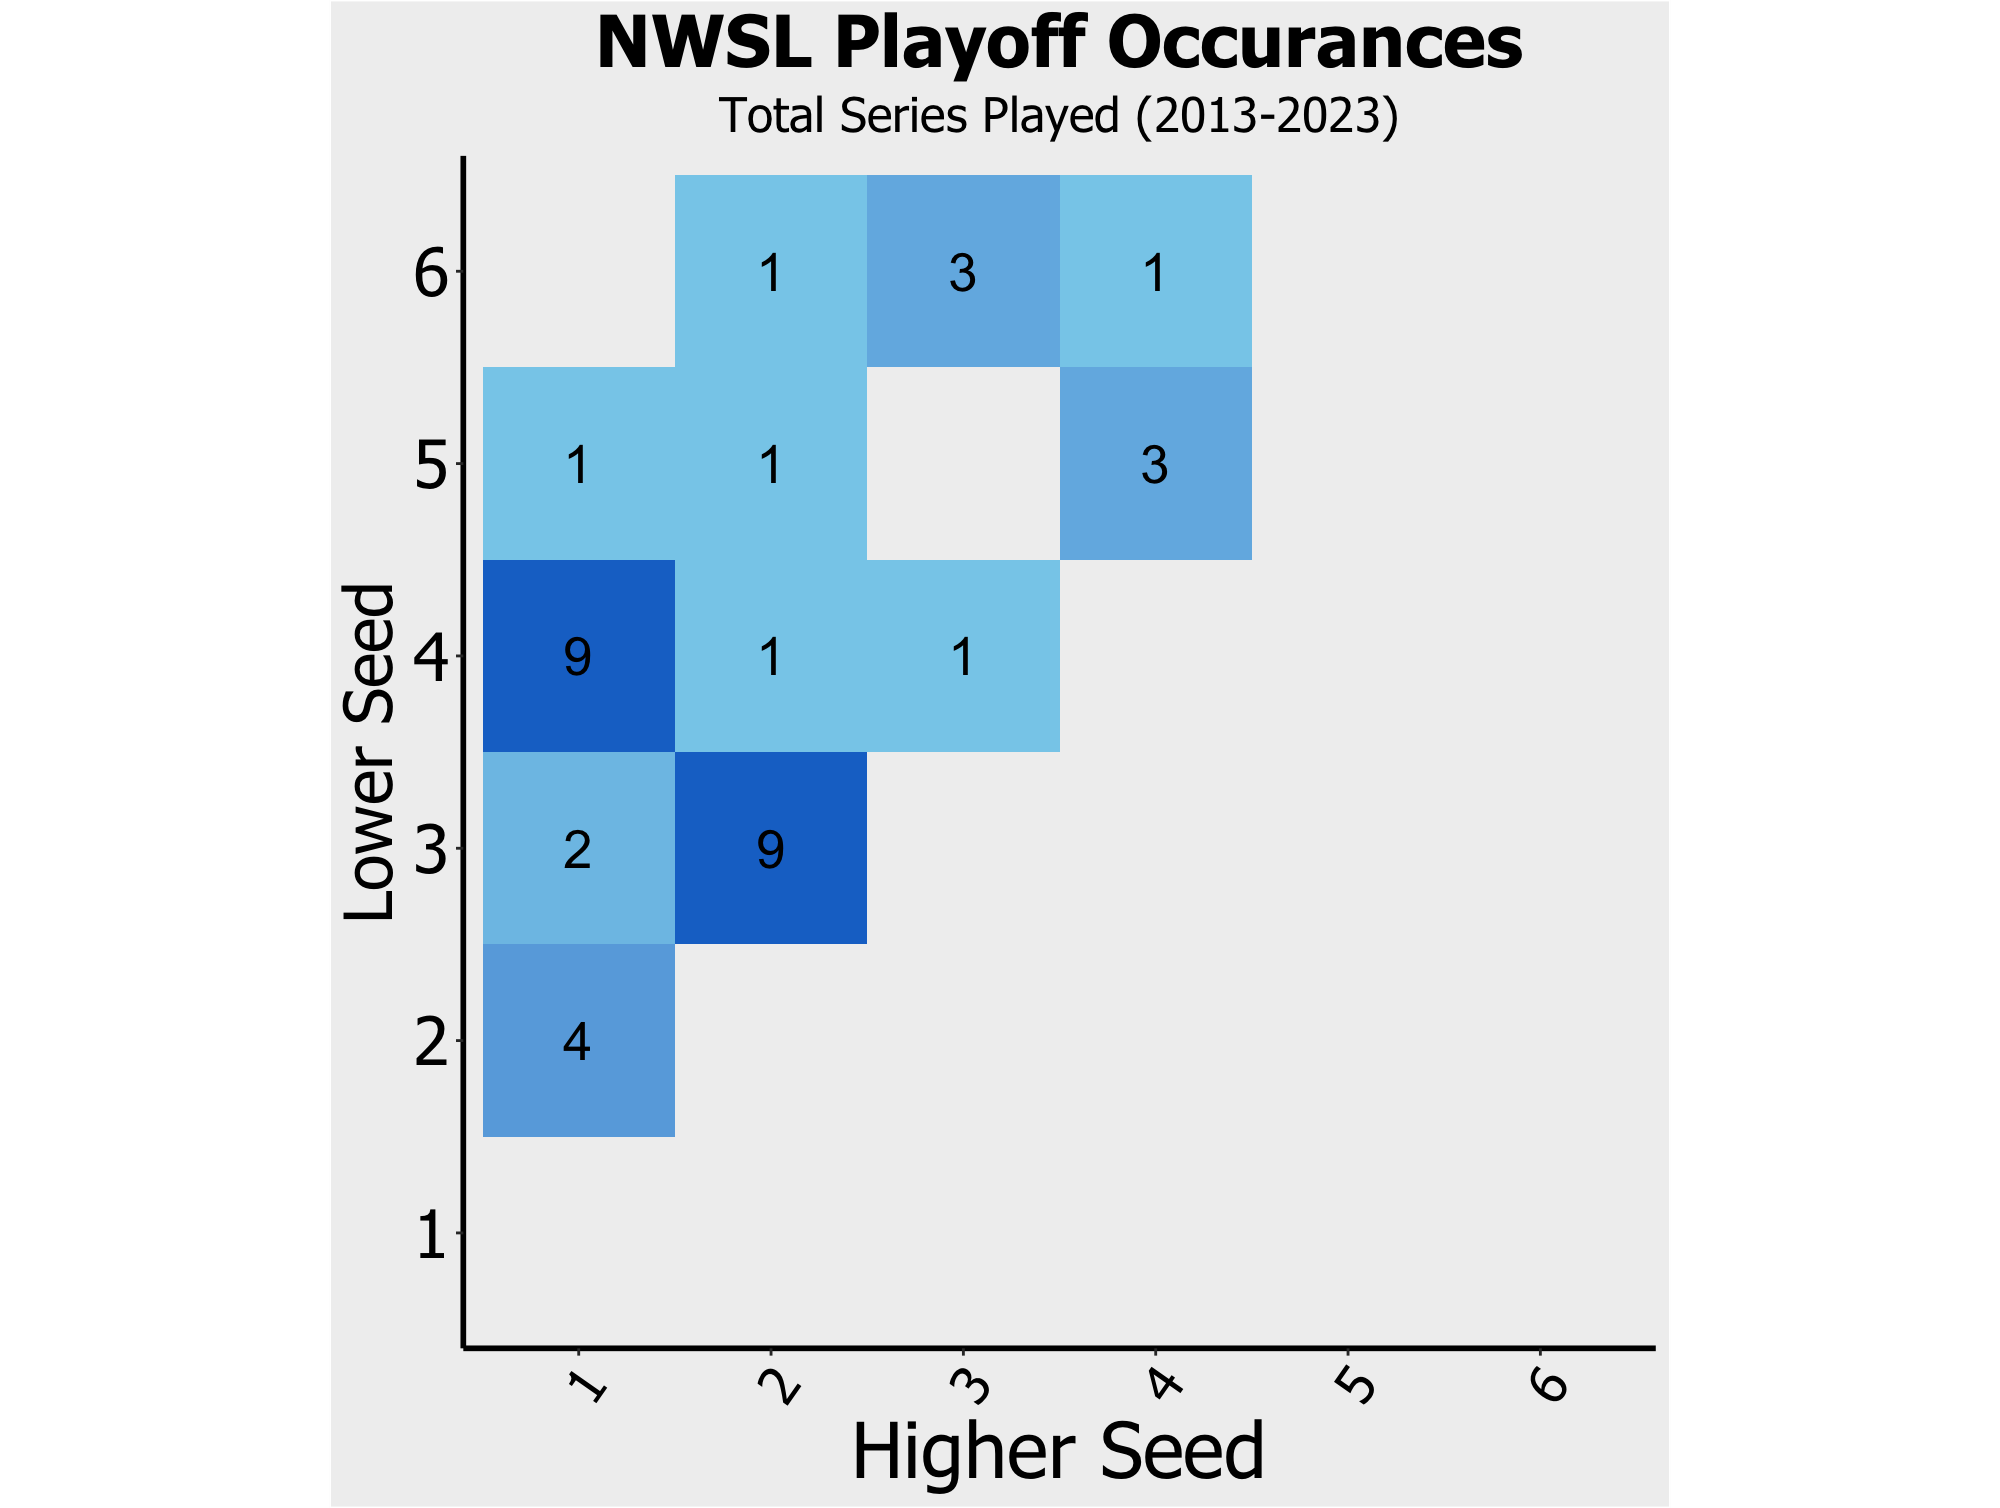
On to the NWSL, their first season was in 2013 and in 2021 they moved from a 4 team to a 6 team playoff, also single-elimination. With 10 champions thus far (no playoffs in 2020 because of Covid), there have been three 3s, a 4 and most recently, a 6 seed champion (NY/NJ Gotham FC). The NWSL has also had it’s last 3 consecutive seasons without the 1 seed making the finals, with a 6 beating a 4, a 2 beating a 5, and a 3 beating a 4. The Portland Thorns lead the league with 3 championships (in 3 appearances), none of which have been as the playoff 1 seed.