Year after year, March Madness continues to prove that data science cannot crack every code. There’s far too much variance among the estimated 120 Billion possible ways to reasonably fill out a bracket. Just as an AI algorithm can’t predict the result of a coin toss any better than a human being can, algorithms can only do so much when predicting a single elimination basketball tournament of 68 college teams that spread across dozens of leagues. While analyzing tournament data won’t give you a perfect bracket, it can however slightly increase your chances of winning your bracket pool. I’ve always believed the fun in March Madness is picking a bracket with your heart, but for the games you can’t make up your mind, maybe some data insights can sway your decision.
The first set of charts below shows the percent of possible outcomes in the past 35 tournaments in which each given seed has made it to the respective round. For example, in 35 tournaments, 1-seeds have had 70 opportunities to make it the championship game (Two teams per tournament), in which 35 times (50%) a 1 seed has played in the championship game. You’ll see that once a one seed makes it to the final four, their chances of winning the tournament begin to increase. Other notable takeaways are that 9 seeds beat 8 seeds slightly more than 50% of the matchups and all seeds greater than 3 have made it to the Sweet 16 less than half the time.
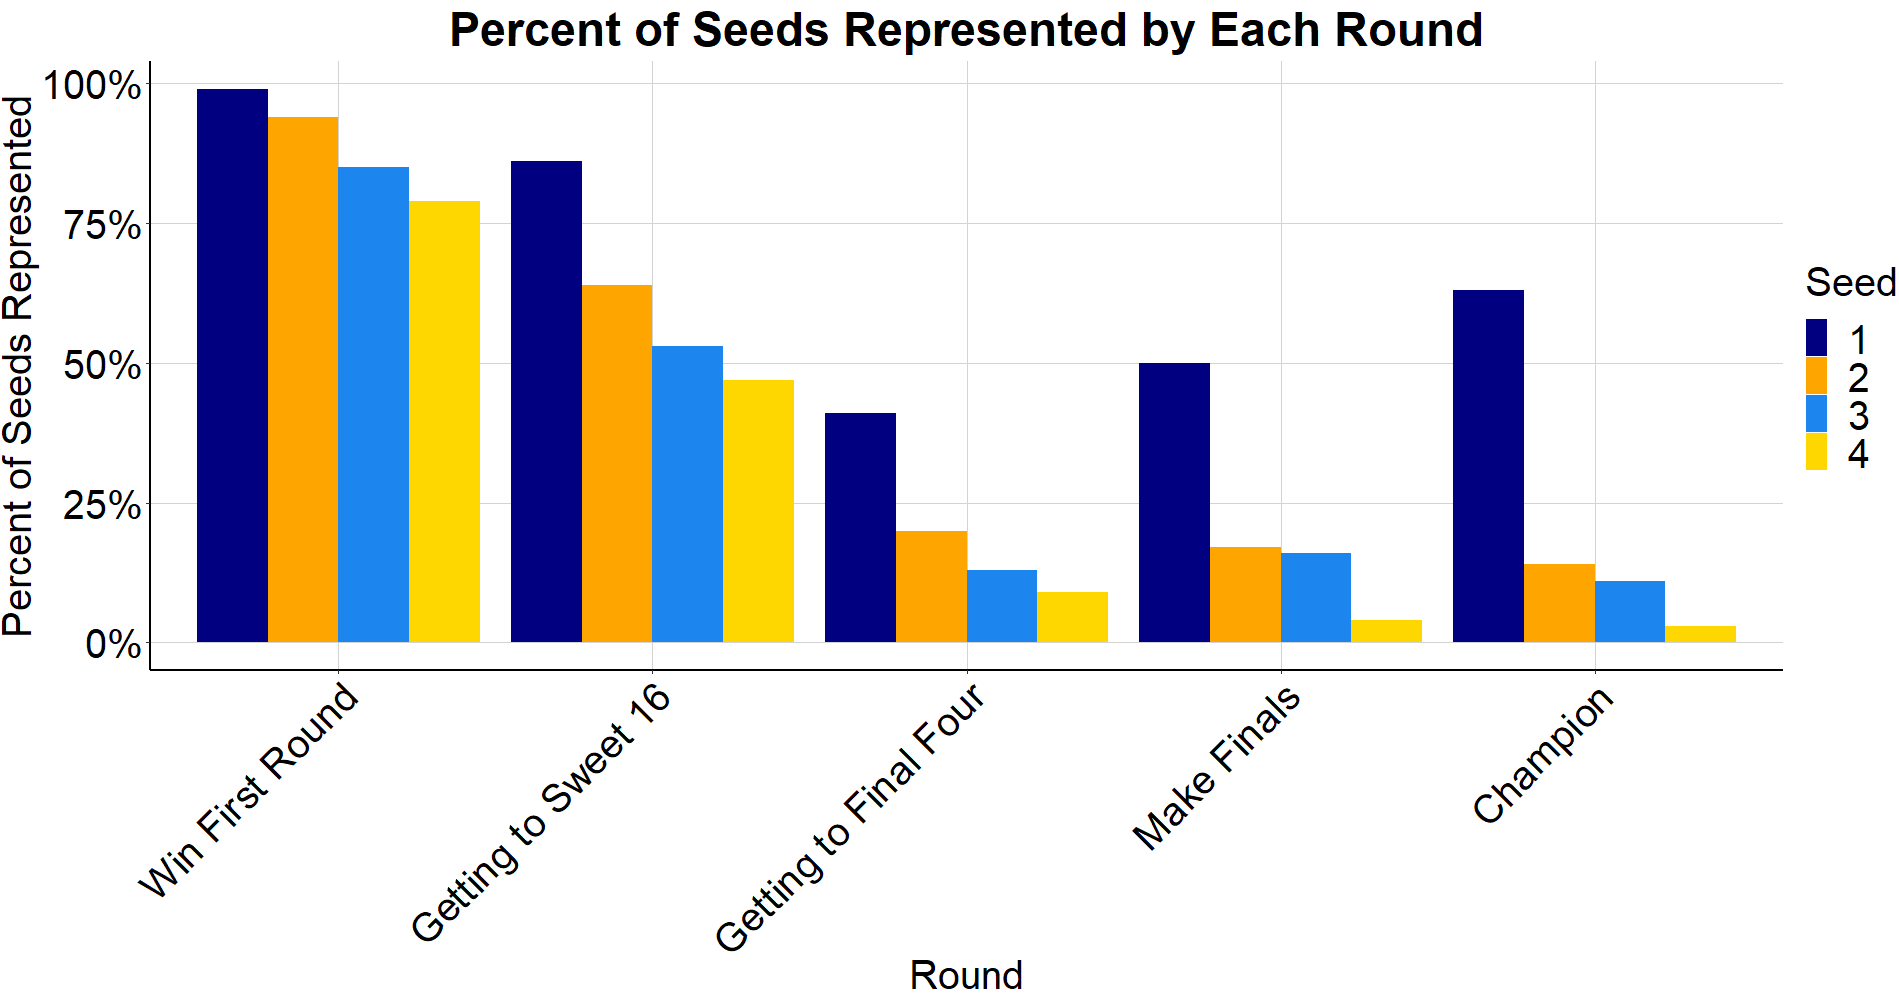
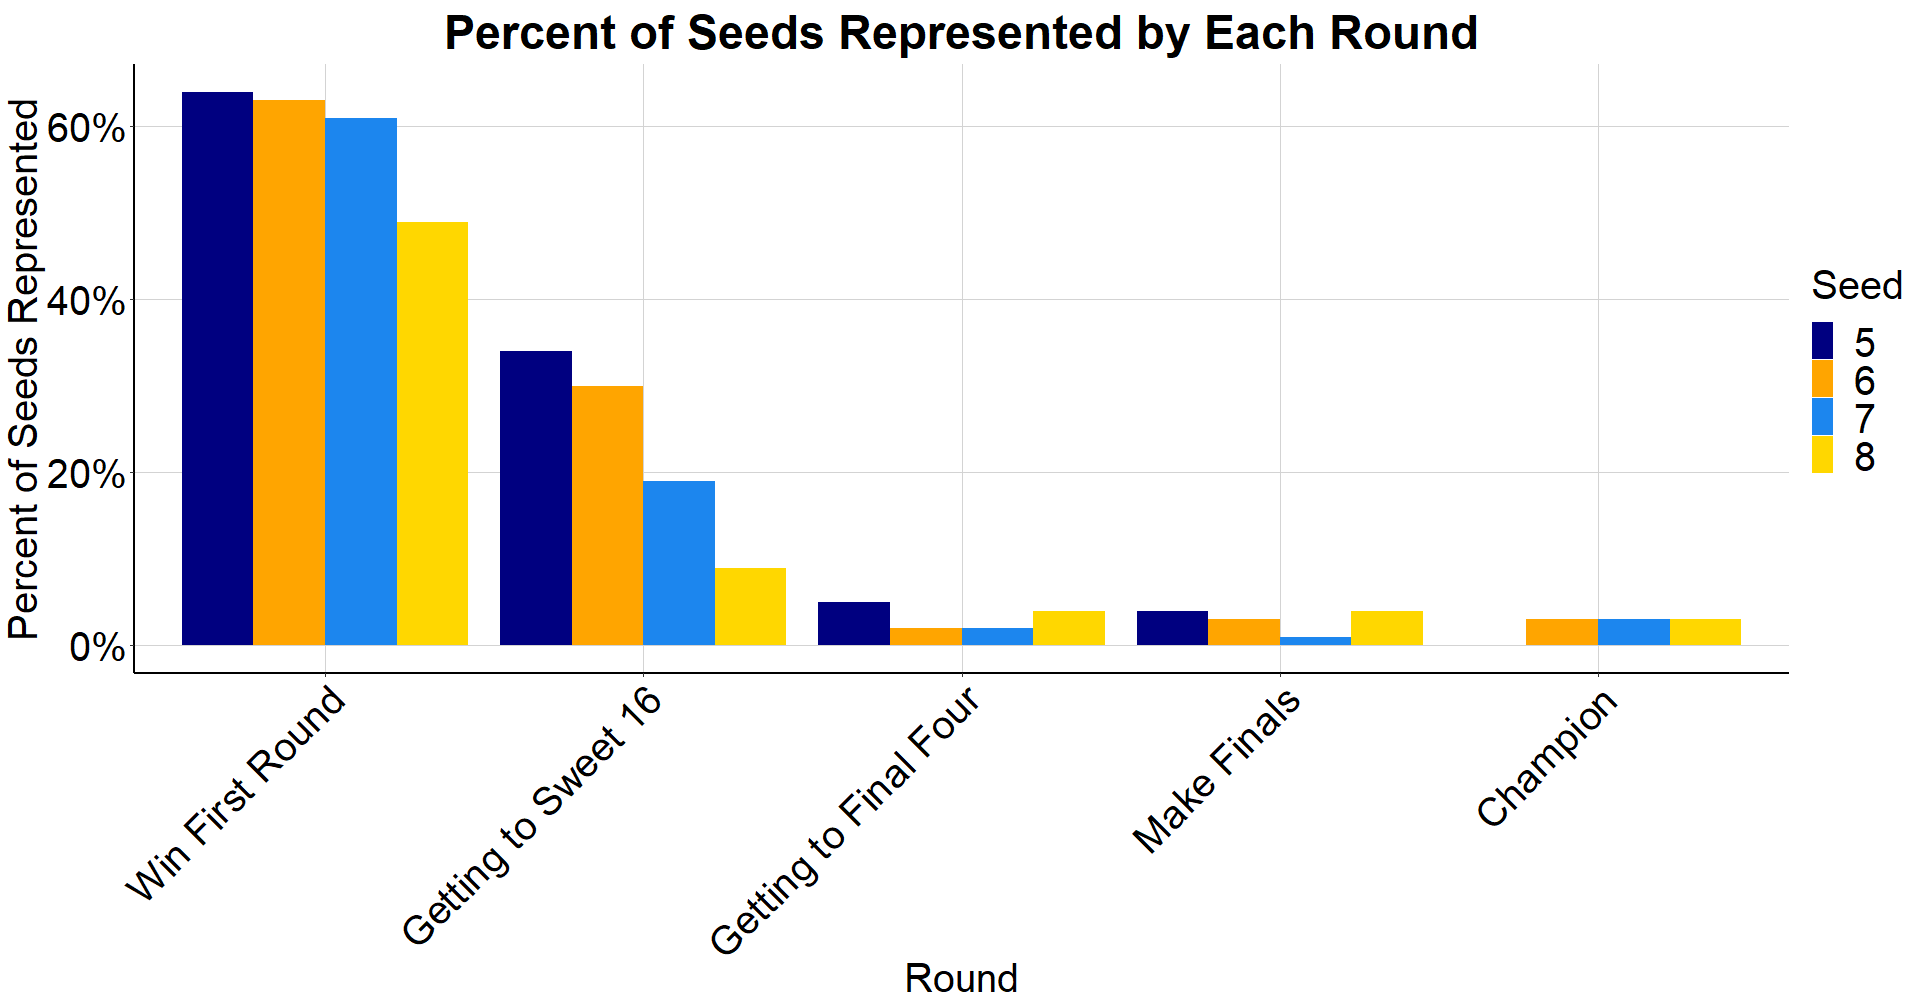
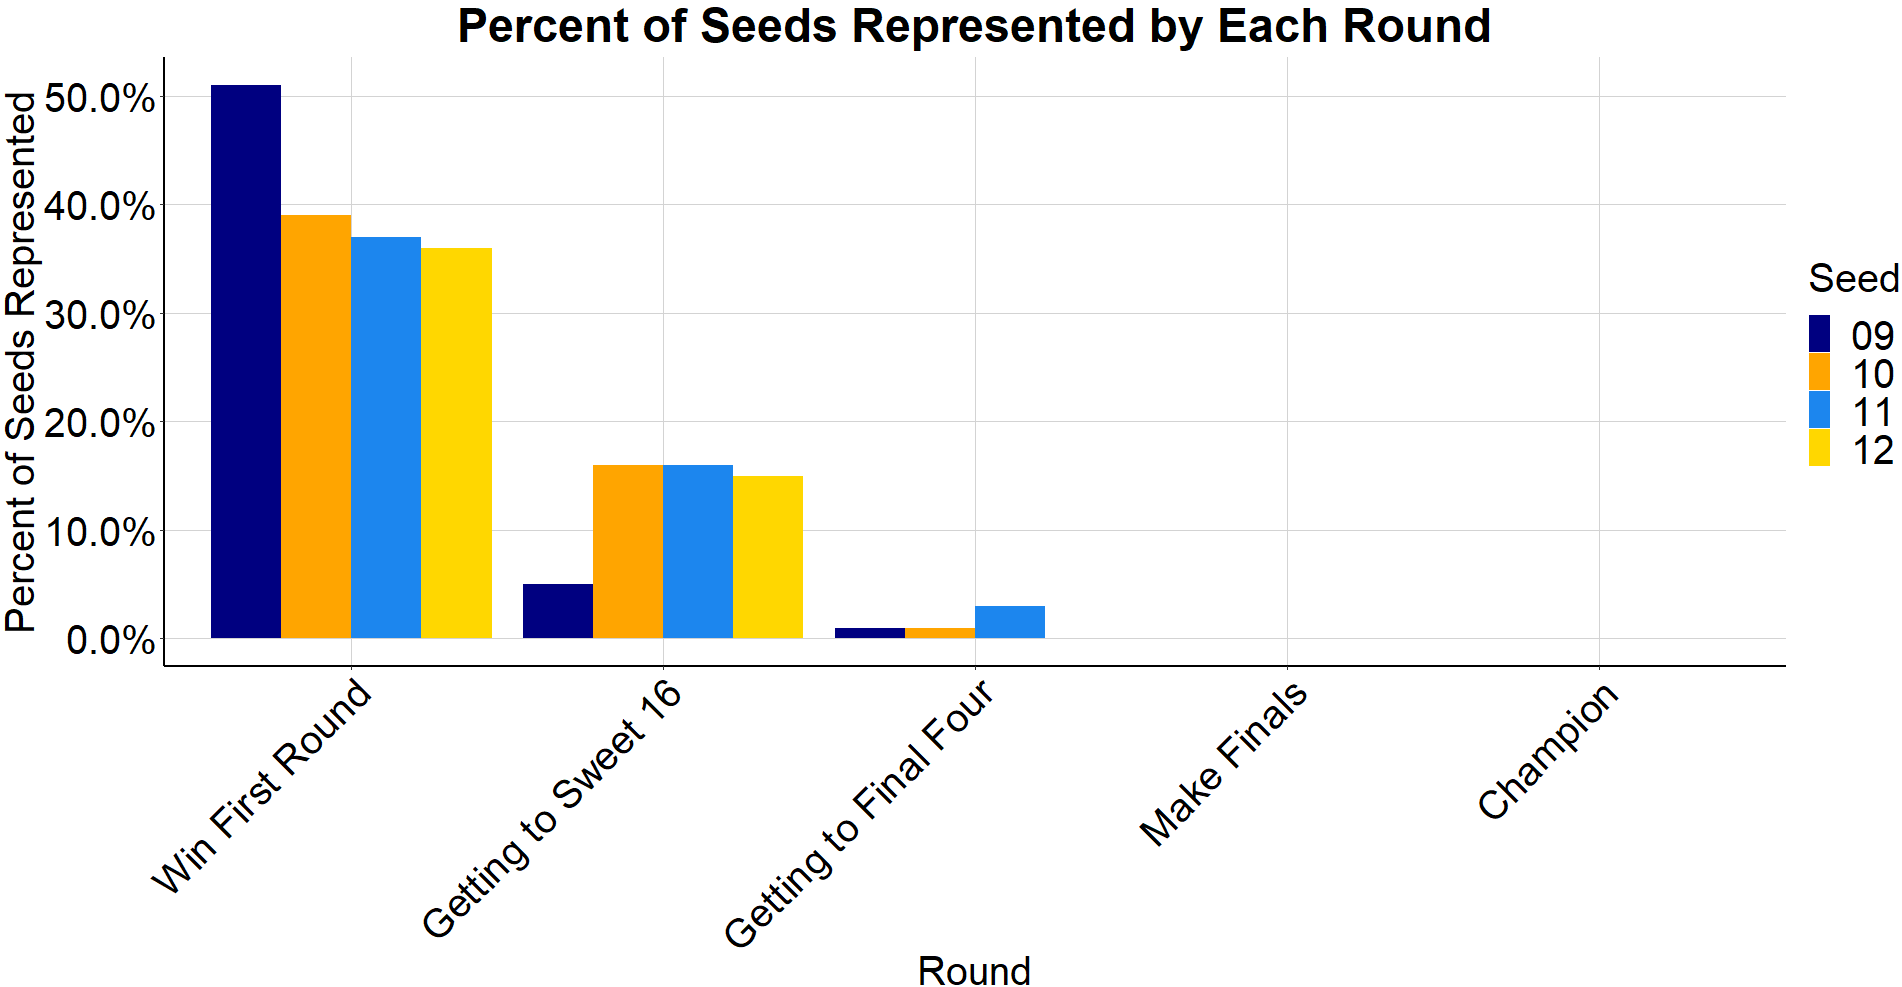
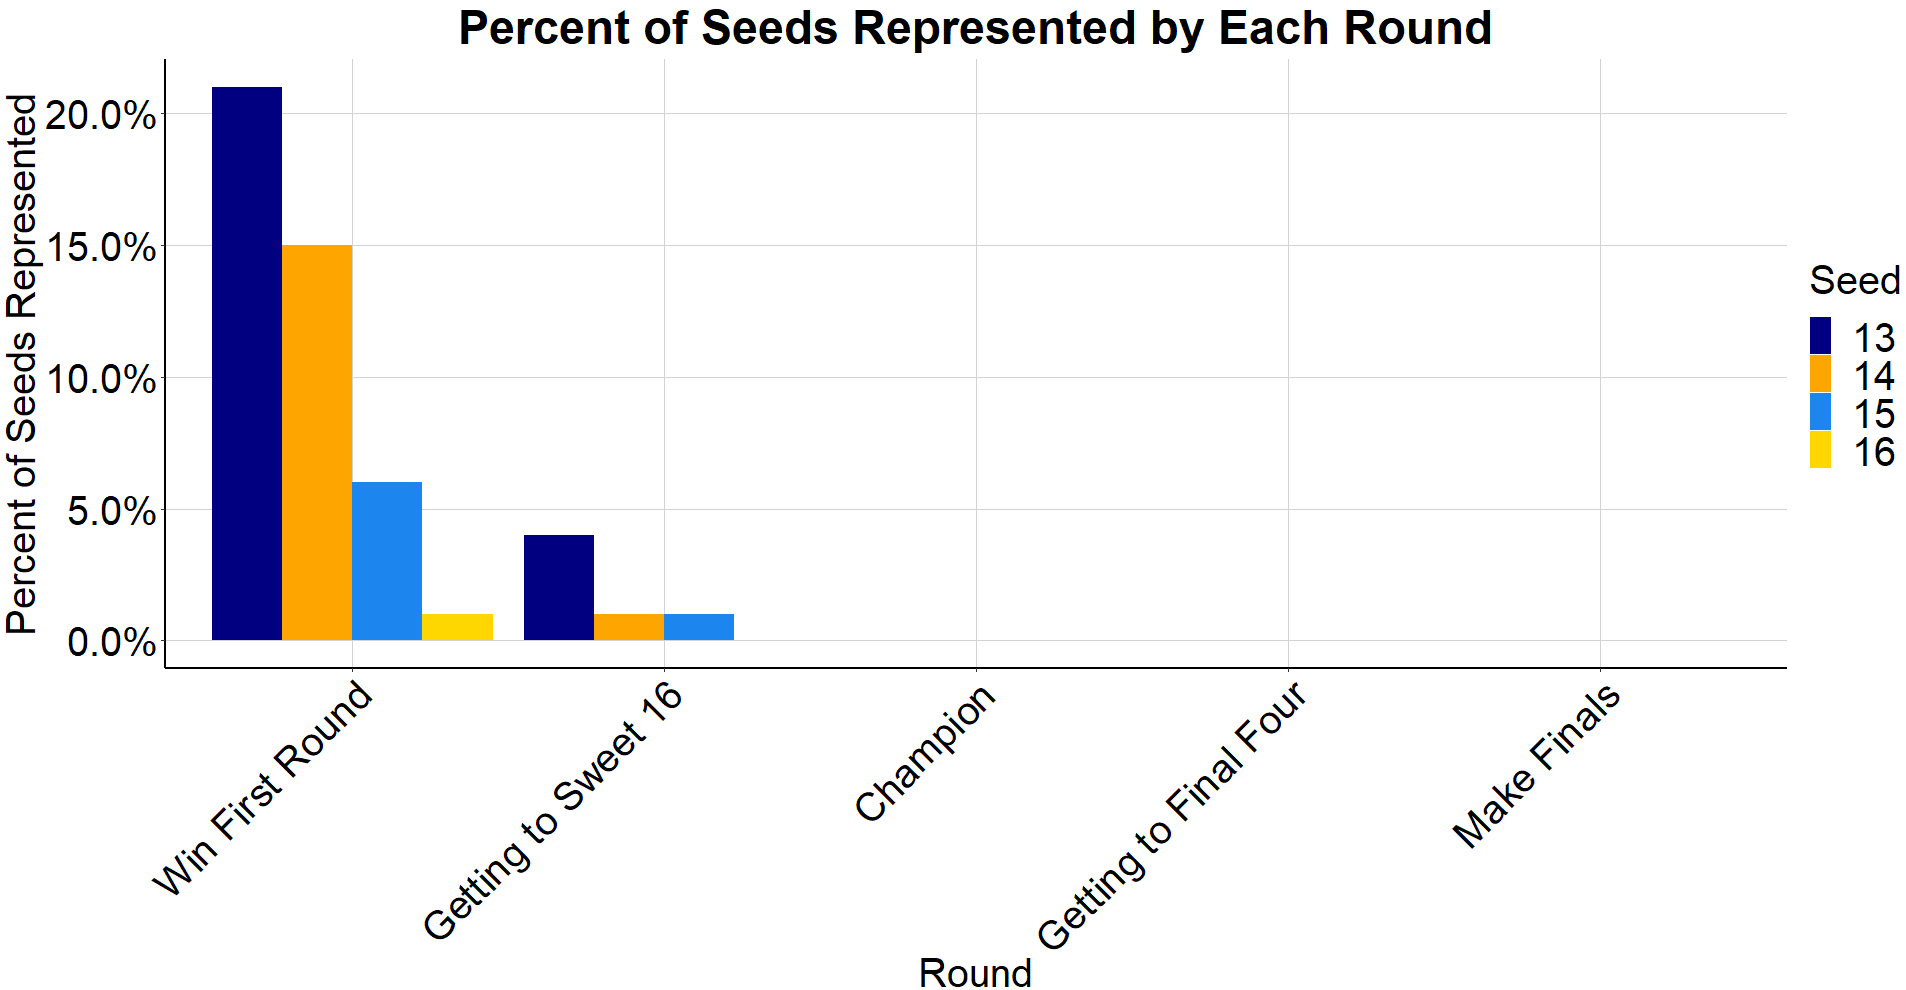
It can also be seen that 10, 11, and 12 seeds make it to the Sweet 16 more often than 8 and 9 seeds, even though they are presumably worse teams. This is because 8 and 9 seeds have to play 1 seeds if they win their first game.
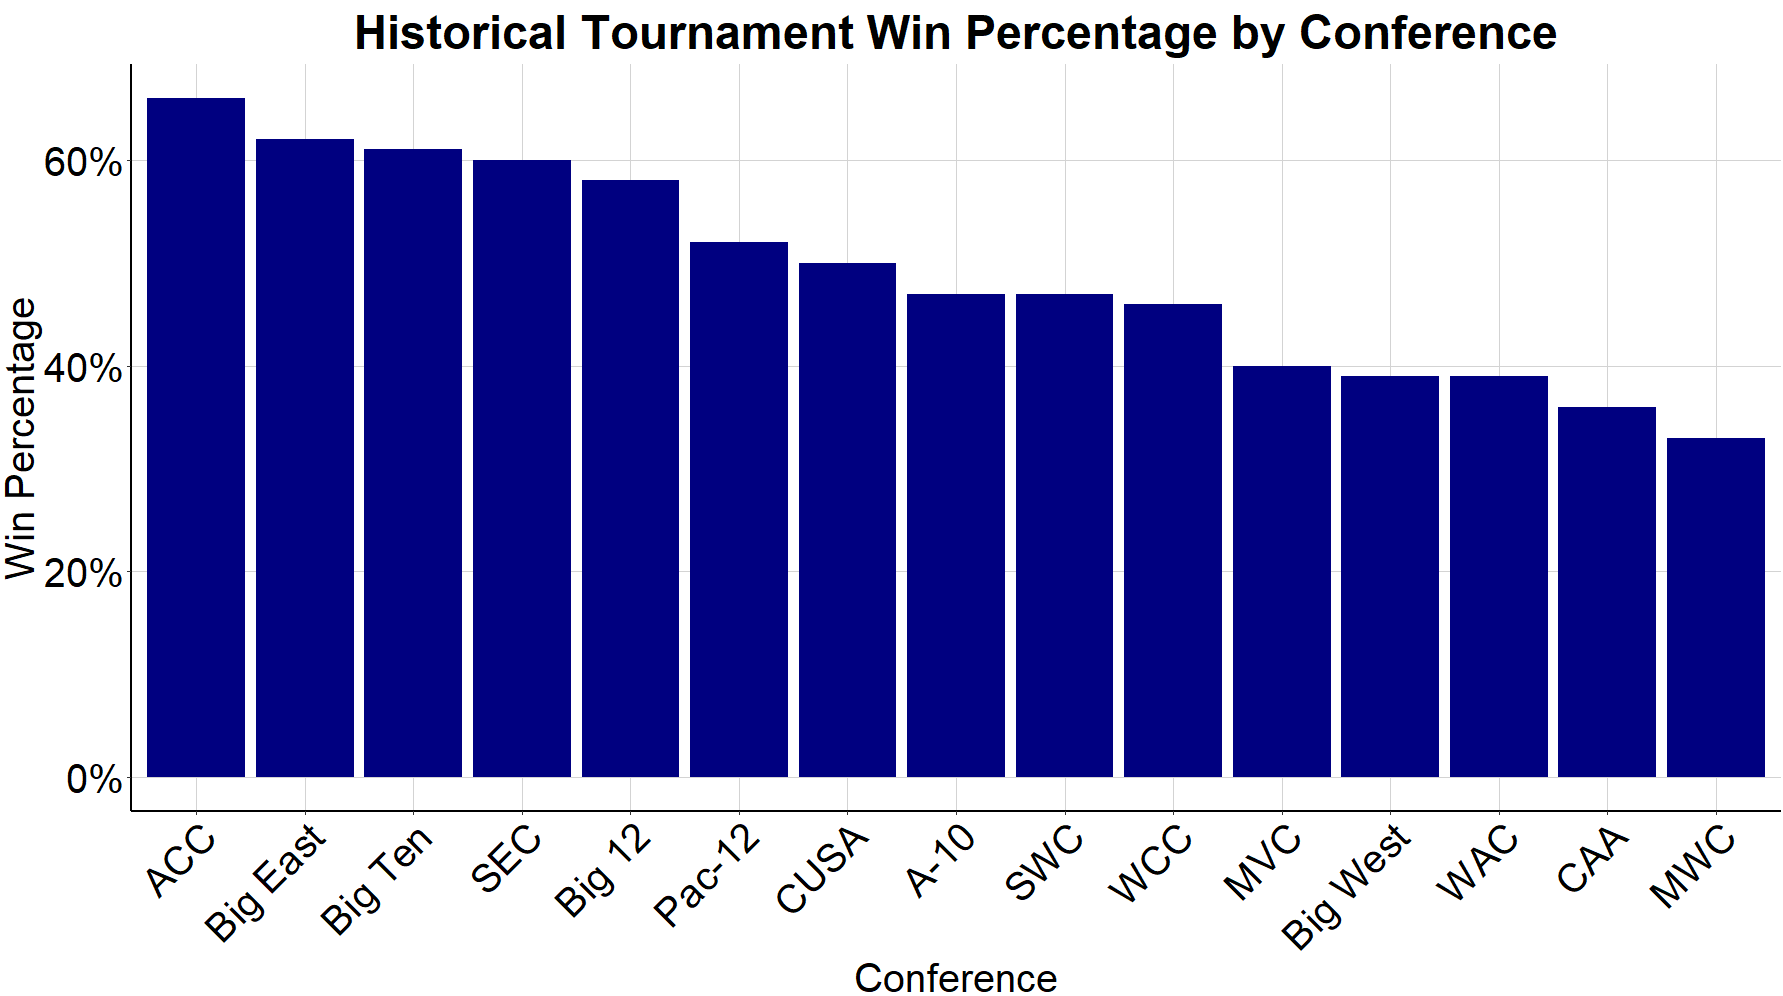
The next chart below shows the tournament win percentages by conference in the past 35 seasons, among conferences with at least 20 cumulative tournament wins. While ACC teams are not as well represented this year compared to years past, the ACC is historically the most successful tournament conference. The Big 10 Conference, third in all time tournament win percentage, will be the conference to watch this March as they have the most tournament teams at 9, 4 of which are in the top 2 seeds.
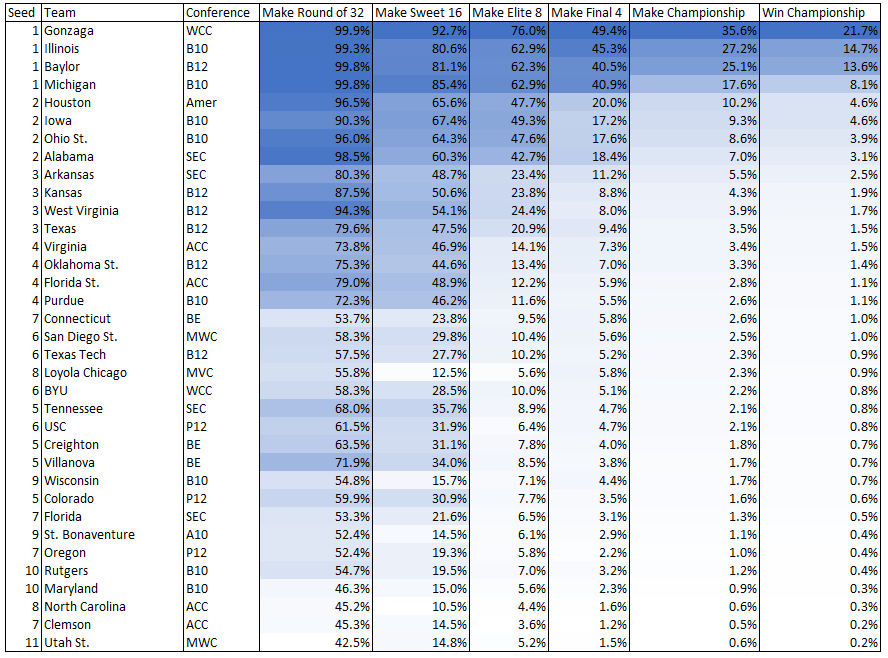
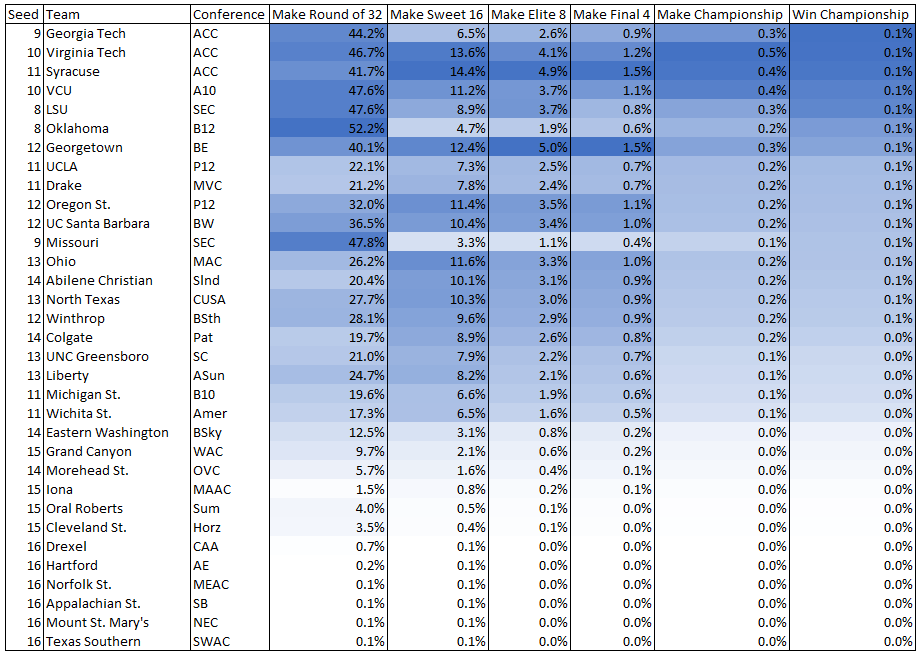
Using historical March Madness patterns and 2021 season data, I’ve output the percent probabilities of each team to make it to each round. Gonzaga is the notable favorite with a 50% chance of making the Final 4 and a 22% chance of winning the tournament. The only other teams with greater than a 5% of winning the tournament are Gonzaga’s fellow 1 seeds, Illinois, Baylor, and Michigan. However, the chances that a team from the rest of the field wins the tournament is still nearly 50%.