
Like all sports leagues around the world, the NFL made several adjustments to their 2020 season in order to accommodate dealing with COVID-19 while still allowing games to be played. Teams played in empty stadiums and several players throughout the league missed games and practices due to either testing positive for COVID-19 or being in contact with someone who tested positive. Additionally, the NFL schedule had to be adjusted multiple times throughout the season; games were pushed back to later weeks or even pushed back from Sunday to sometime in the middle of the week. In attempt to understand how these adjustments may have affected game play, I’ve compared NFL play-by-play data between the 2020 season and previous seasons.
Many aspects of the NFL change year over year so it’s important to not attribute the changes we see in this analysis to COVID-19-related adjustments without statistical evidence. Nonetheless, we will see some dramatic differences in 2020 data compared to previous seasons and seek their explanations.
First, the home team won a fewer percentage of its games this season compared to any season in recent history. This plays nicely into the theory that fans contribute to helping the home team win games. The chart below shows the percentage of games won by the home team in the NFL over the past 5 seasons.
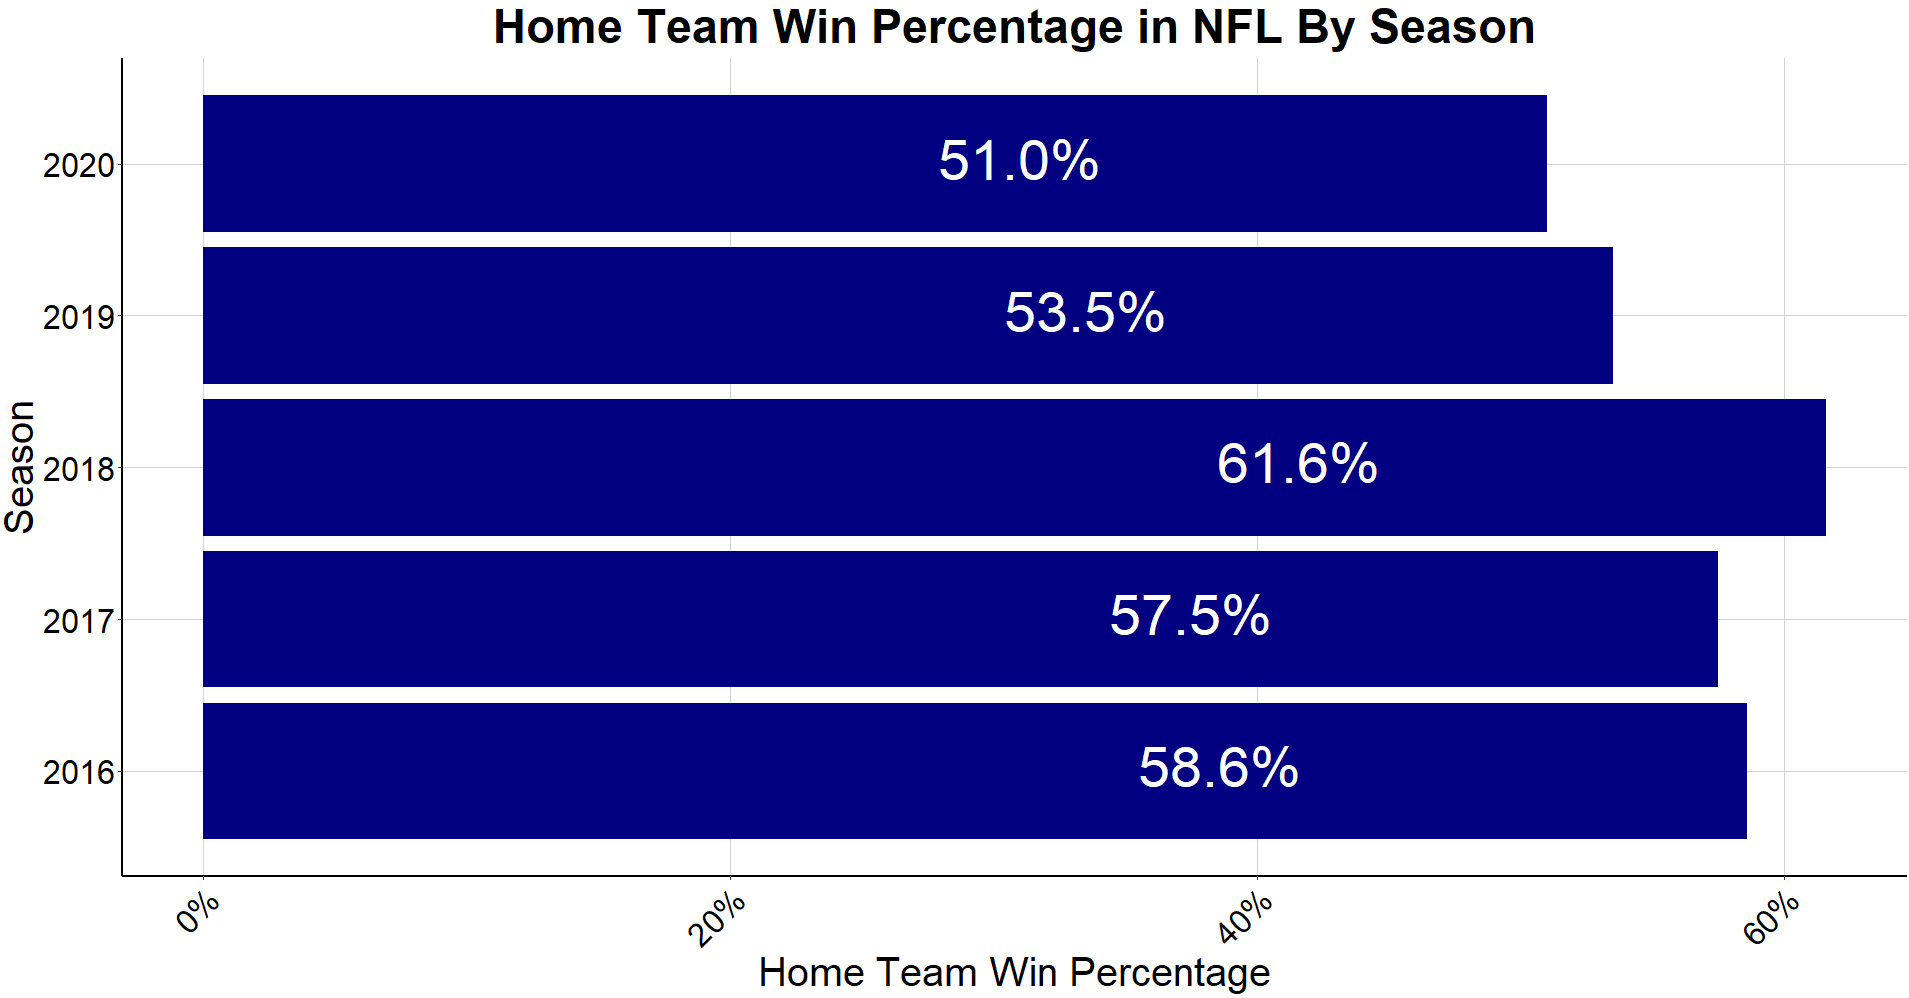
In 2019, the home team won just 53.5% percent of its games, which is an adequately lower percentage than years prior. What we don’t know is whether 2019 was an outlier year for lack of home field advantage or the trend of home field advantage was shrinking for reasons that we may not be aware of. If the former is true, then 51% of home wins in 2020 is abnormally low. If the latter is true, then perhaps the fans make a much smaller impact on the game than perceived and visiting NFL teams are finding better ways to deal with the obstacles that come with playing on the road. If the NFL can fill stadiums in 2021, then we’ll have better insight into this, but based on year over year trends, my own hypothesis favors the former; that 2019 was an outlier season and the empty stadiums of 2020 did take away much of the home field advantage.
In addition to the fans, the other aspect that affects home field advantage is the travel of the visiting team. In the 2020 NFL season, elements of travel such as jet-lag, players not sleeping in their own beds, and the unfamiliar turf, remained a constant. Having removed one known aspect of home-field advantage, we can estimate that 1.5% of the variance of the outcomes of NFL games can be explained solely by the effects of travel.
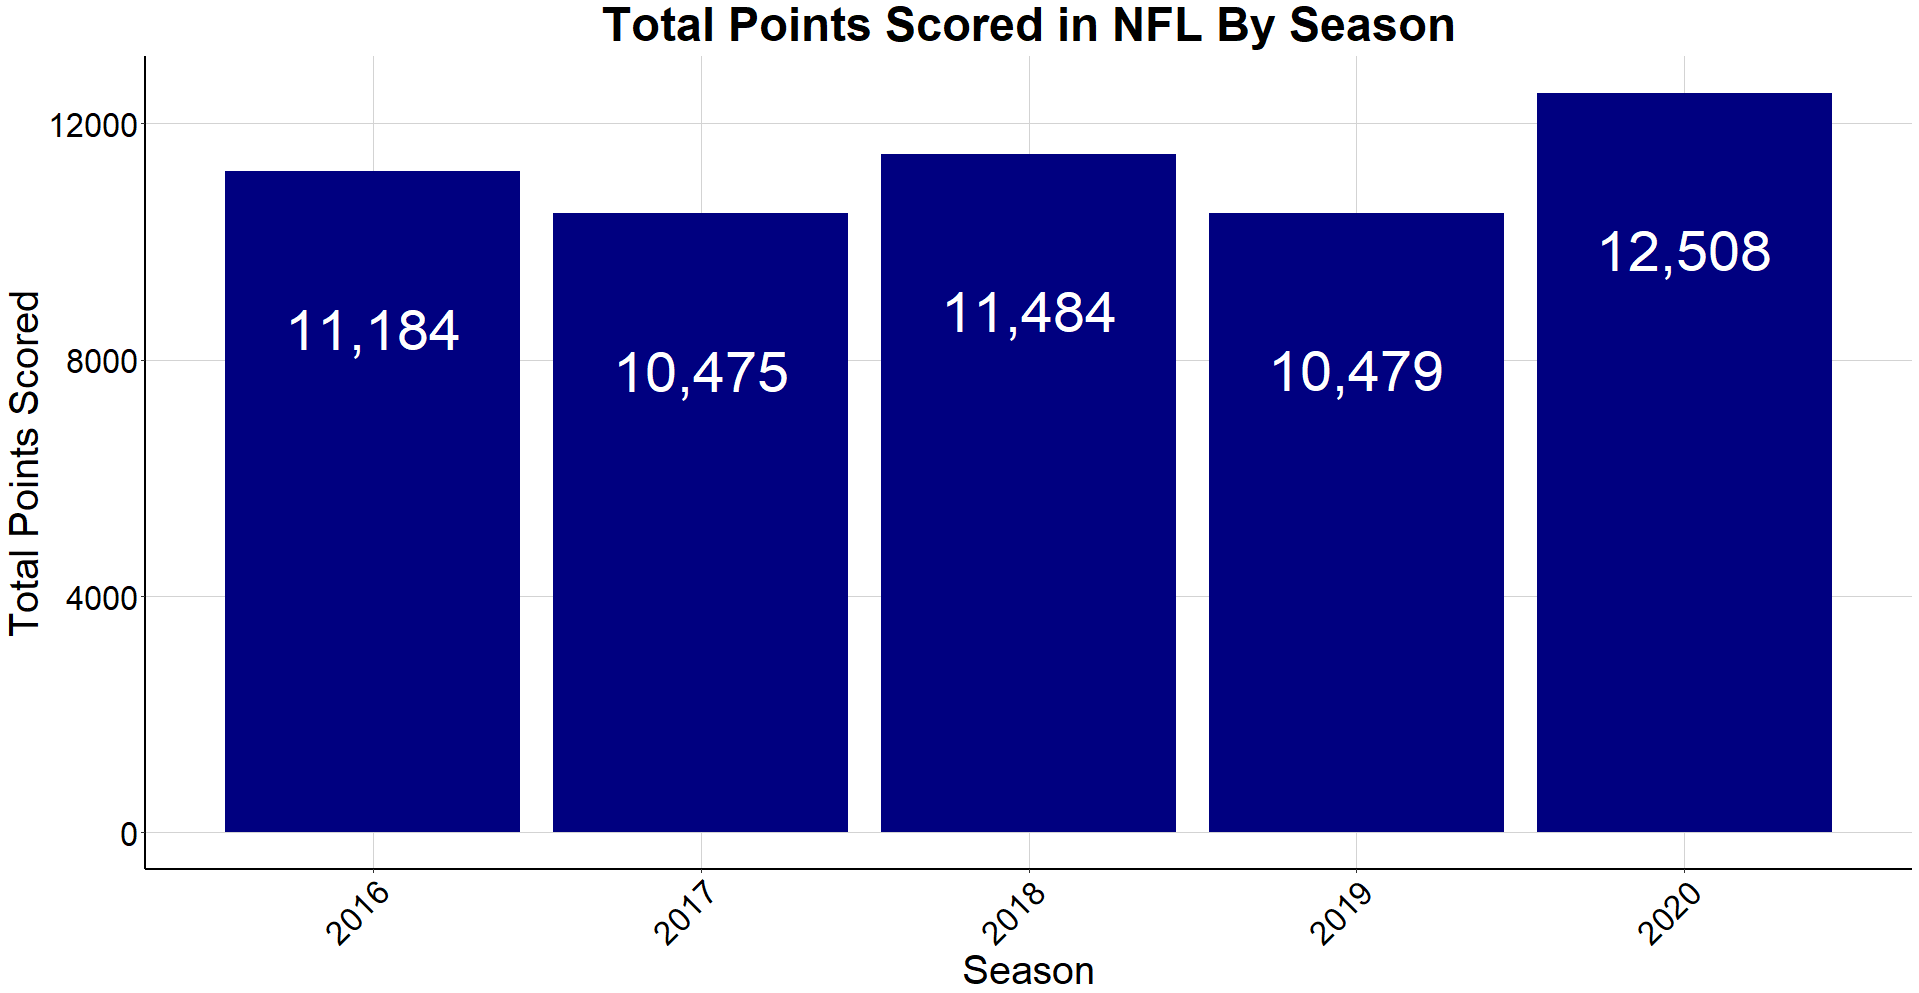
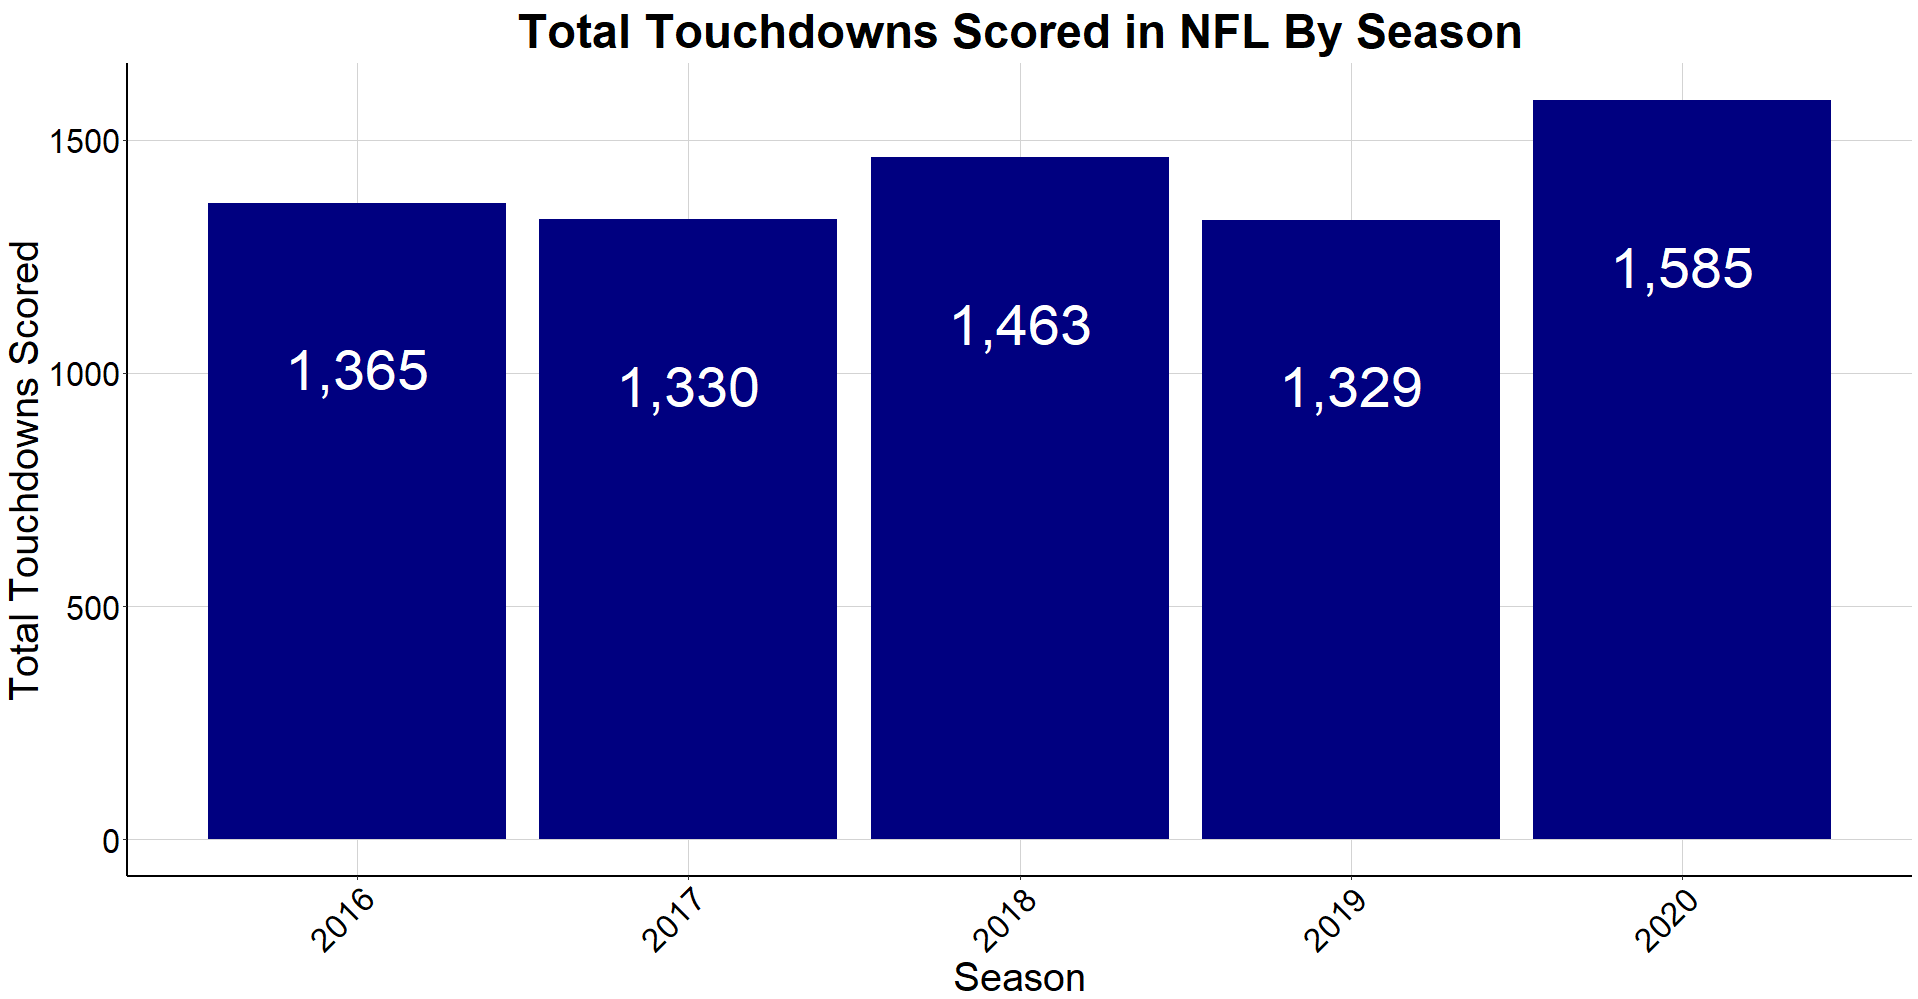
The next two charts below show another obvious change in the 2020 season; the high offensive production across the league. This season saw an increase in points by 15% compared to the average of the previous 4 seasons. Does crowd noise favor the defense, was there a change in offensive strategy, or perhaps a combination of both? We’ll dive deeper into offensive metrics to get a better idea.
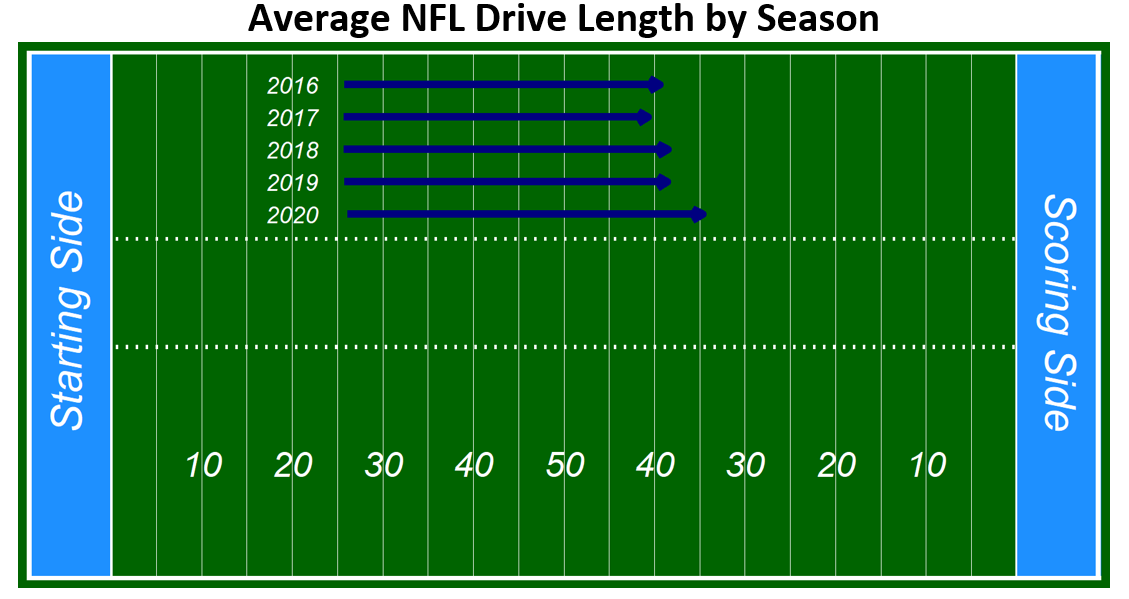
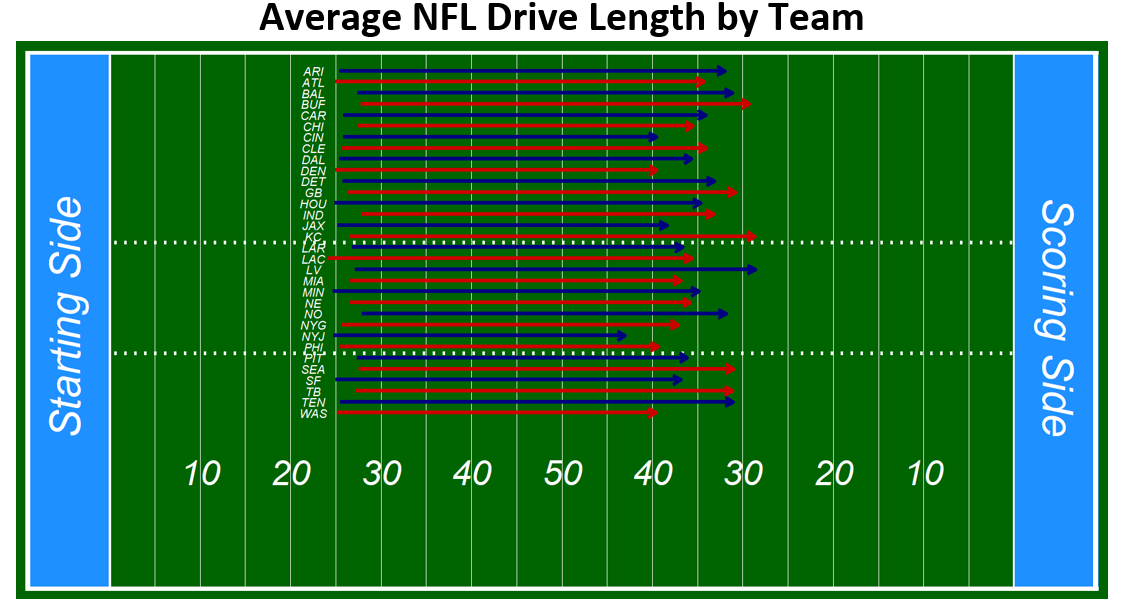
From the chart below, we can see the driving force behind increase in points scored. The arrows represent the yard lines in which the average NFL drive began and ended per season. In 2020, offenses were averaging almost an additional 5 yards per drive. The second chart below breaks down the average drive by team so that you can see how your team faired in 2020 compared to the league.
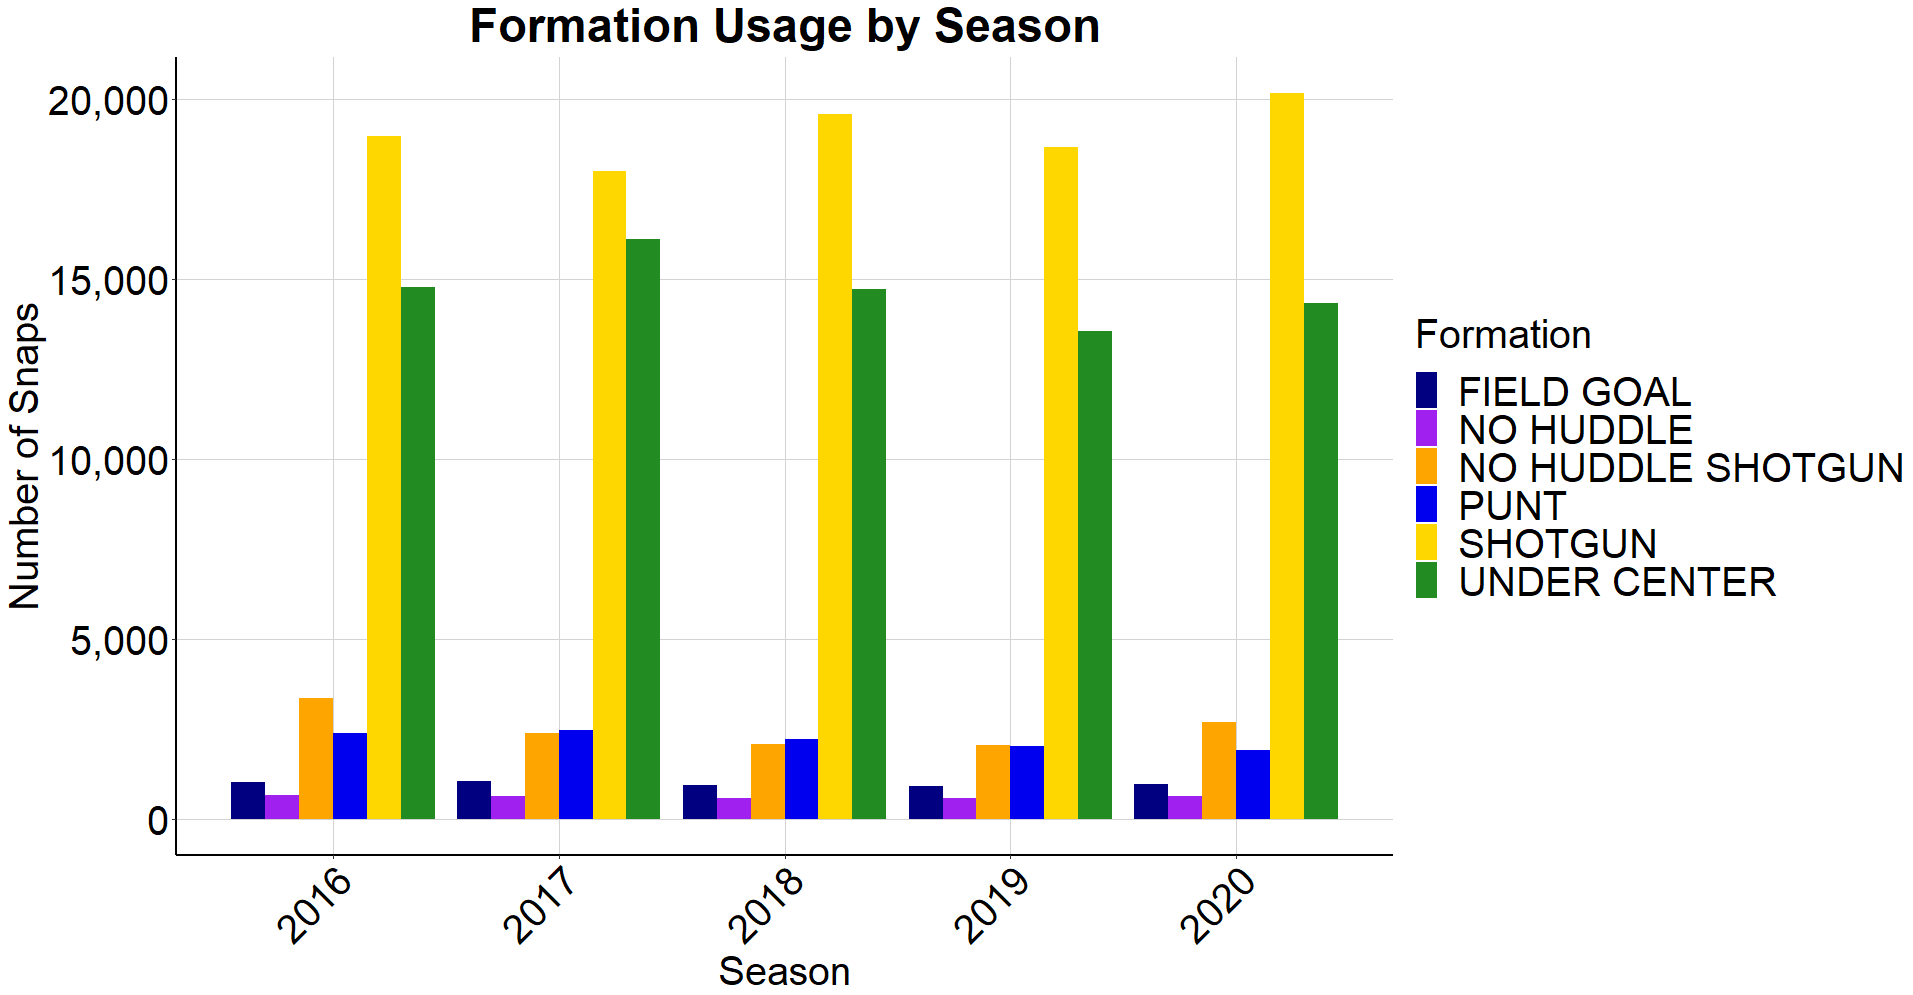
Now that it’s clear that offensive efficiency rose in 2020, we’ll break down different aspects of the offensive side of the game in order to see what changed this season and what did not. The chart below breaks down the number of snaps per season by formation. While there were slightly more overall snaps in the 2020 season than in prior years, the breakdown of snaps by formation remained just about the same.
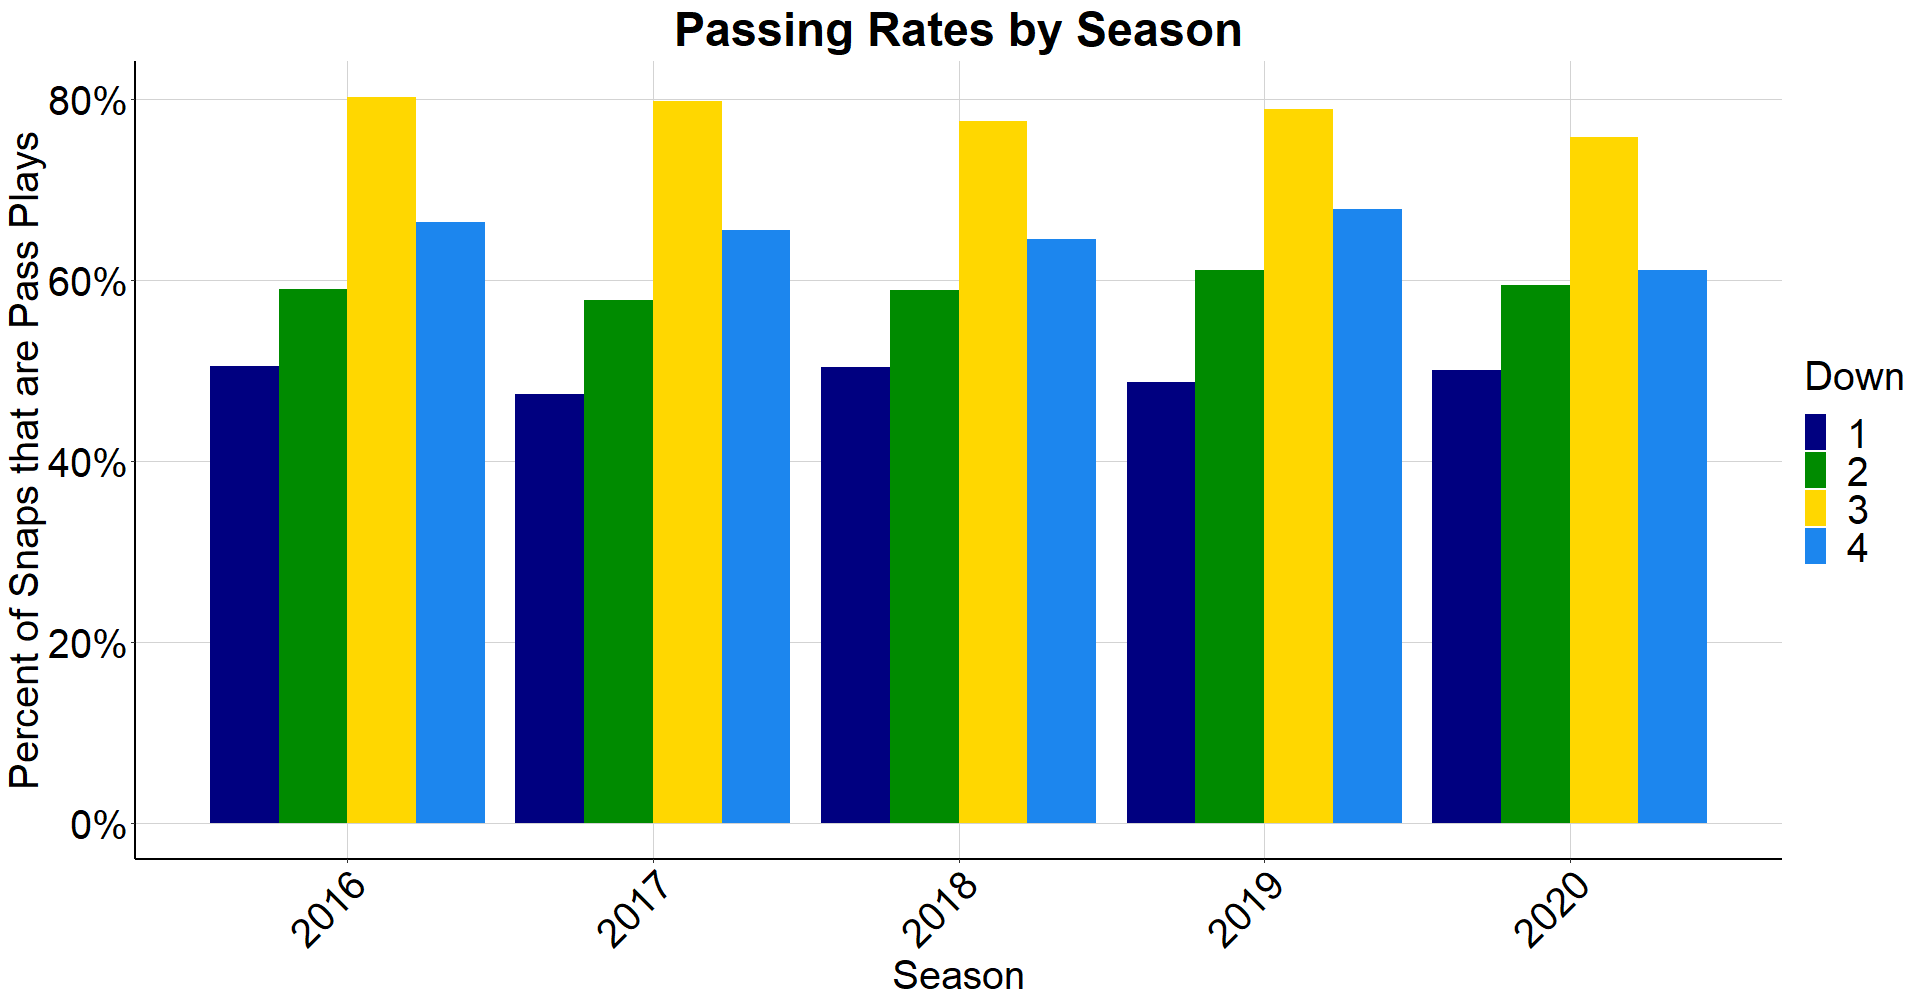
Next, the chart below informs us of the percentage of snaps on each down that are pass plays compared to rush plays. We find no statistical evidence that passing rates have changed this season.
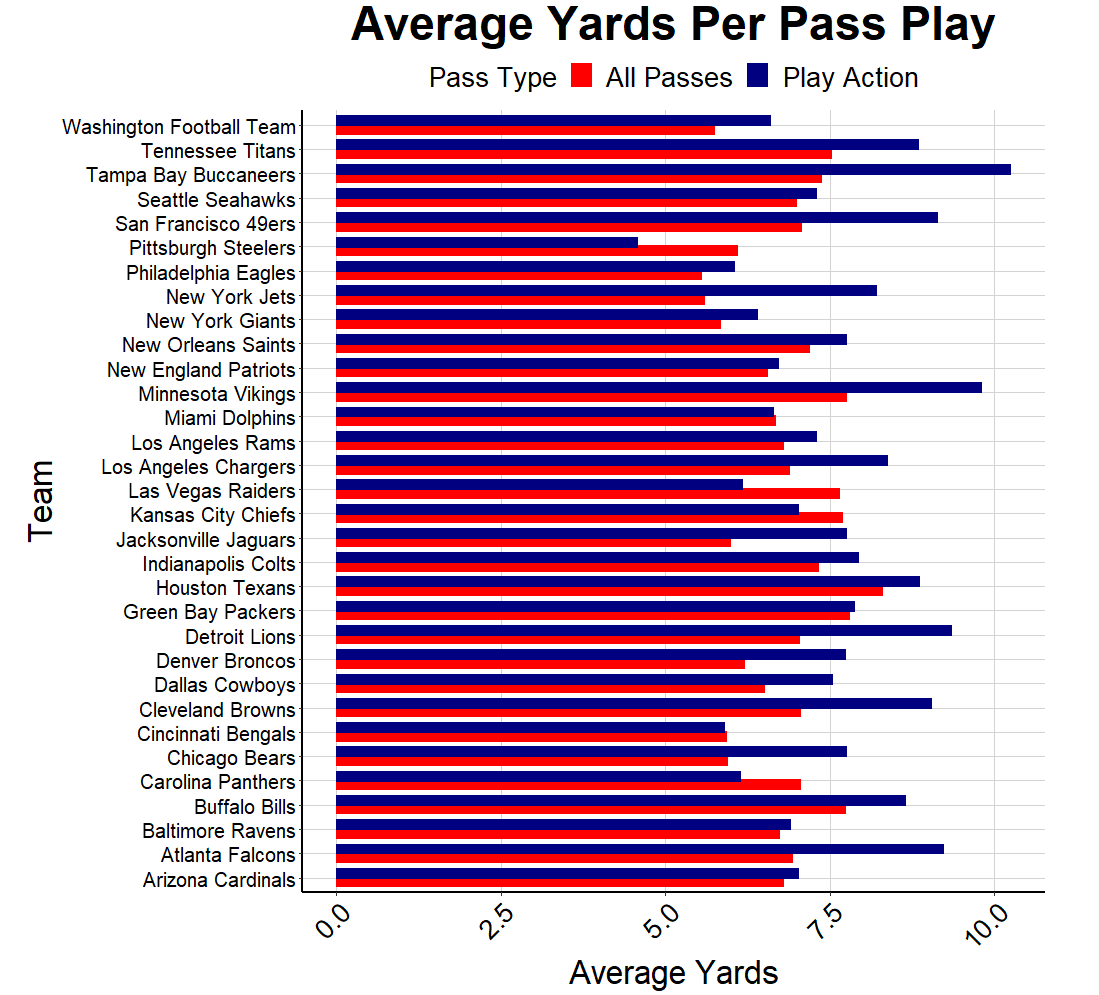
We can also break down pass plays by regular passes against play action passes. From the chart below, we can see that 27 of the 32 teams in the NFL had a higher average yards per play action pass than they do for pass plays in general. However, the 2020 NFL season saw just 22.7% of all pass plays use play action, a downward trend from 2019 and 2018, which were 26.6% and 27.2% respectively. The benefit of play action is the element of surprise on the defense, which would be mitigated if overused, but NFL teams certainly should be using play action more than they currently are.
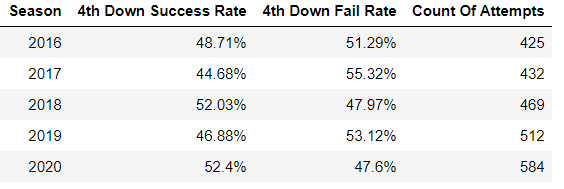
While it’s clear that formations and pass rates are not a factor in increased points this season, we finally can see a change in coaching decisions that do positively impact overall points scored. In 2020, teams are going for it on fourth down more than they have in recent history. Regardless of the outcome of a 4th down conversion, it almost always increases the potential for the game to have more points scored. Either the offense gets to continue their drive on first down, or the defense gets to take over the ball in much better field position than they otherwise would have.
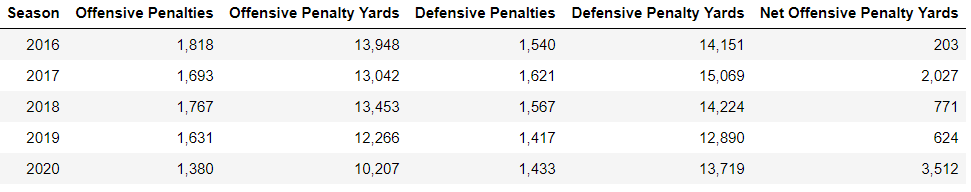
Another notable factor that has favored offenses in 2020 compared to prior seasons is the rate of penalties. From the chart below, we can see that defensive penalties and penalty yards remained relatively constant in 2020, but offensive penalties and penalty yards dropped substantially. This supports the theory that some offensive penalties such as false starts are a function of crowd noise, typically disadvantaging the visiting team. Whatever the reasons, in 2020, offenses gained an average net positive 14 yards in penalties per game when they averaged just about 3 net positive yards in penalties per game in the previous 4 seasons.
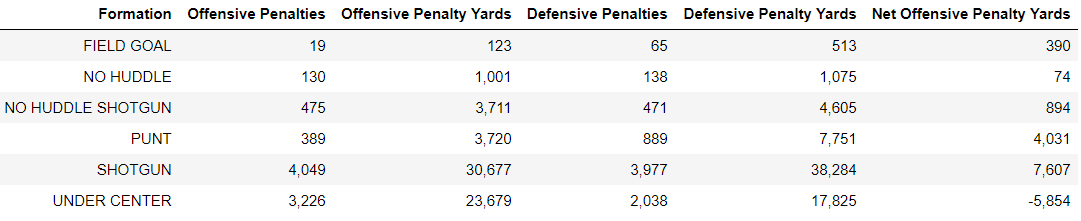
For a better idea of when penalties occur, the below table breaks down the number of penalties in 2020 by offensive formation. Note that snaps under center are the only formation in which the offense has negative net penalty yardage.
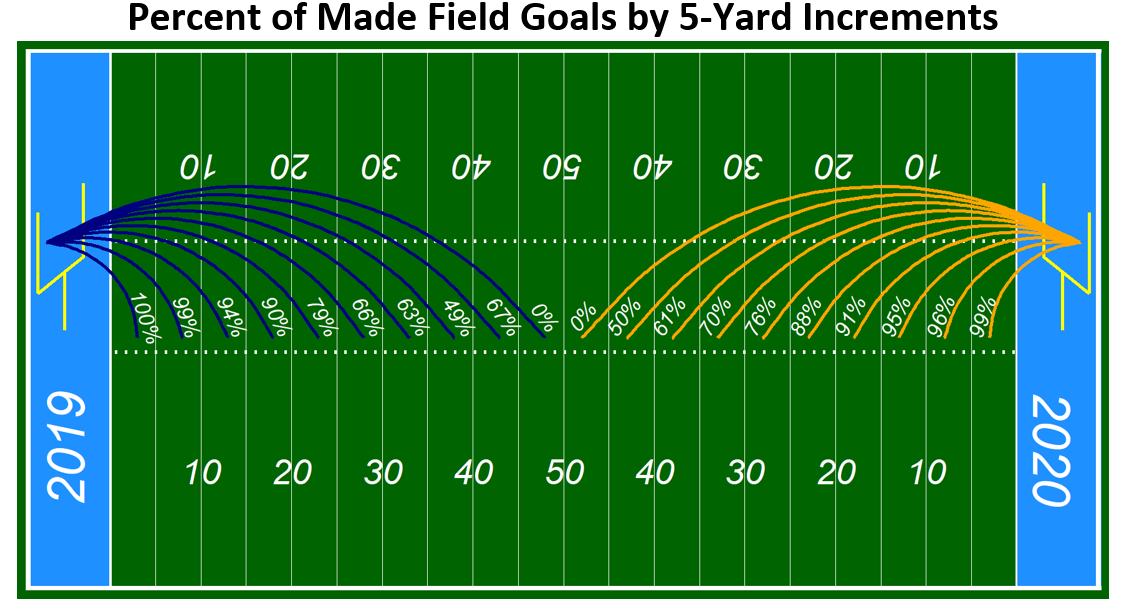
The final piece of this analysis is to look at field goal kicking. In 2020, the number of field goals taken and the percent of field goals made remained relatively constant with prior seasons.
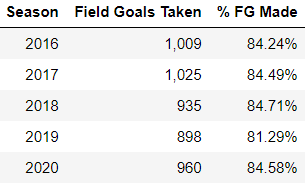
In the last chart below, we can see the percent of field goals made by increments of 5 yards, comparing the 2020 and 2019 seasons. Just as the above table shows, there were not any notable change in field goal kicking this season.
Having looked at several aspects of the game, the adjustments that the NFL made with regards to COVID-19 do seem to have affected gameplay in 2020. To exactly what extent is still unclear, but we found sharp differences in the lack of home field advantage, increased points scored and offensive efficiency, and decreased offensive penalties while maintaining similarities in offensive play calling and field goal kicking. The 2020 NFL season will always be remembered in a unique manner, but time will tell just how unique the statistical outcomes of the season really were.