
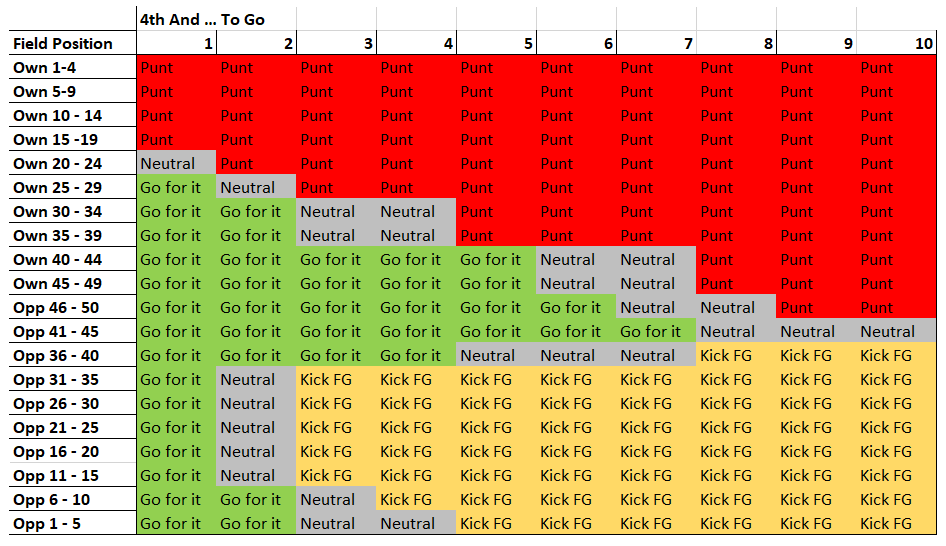
With the 2019 NFL season under way, we’re reminded of the timeless debate about whether teams should go for it on 4th down, depending on the game situation. While coaches, players, and fans may all have different opinions on the matter, I’ve analyzed over 100 thousand snaps from the 2016-2018 NFL regular seasons to form statistical decisions that will maximize the probability of winning the game. The below chart summarizes my results, followed by an in-depth breakdown of the steps I took in Python to transform raw play-by-play data into usable results. This chart should be interpreted as a general baseline for NFL teams as it does not account for game factors such as score, time left in the game, team ability, weather, etc.
The primary goal of my analysis was to create a decision chart that displays the statistically optimal 4th down choice a team should make depending on field position and yards to go. With an ever-changing NFL (higher scoring games, new rules, etc.) I decided that 3 seasons of data (2016-2018) would give me enough plays to have valid results while also not derailing my analysis with old data that might not apply in today’s game. In order to achieve my output, I broke the analysis into 4 sections and aggregated the results as my final step. The 4 areas of analysis are:
- Expected Points on a Drive (Depending on starting field position)
- 4th Down Conversion Rates (Different for goal to go Vs. regular)
- Expected Net Punt Distance (Depending on returns and touchbacks)
- Field Goal Percentage (Depending on distance)
For each of these areas, I used Python in a Jupyter Notebook as my statistical analysis tool. I’ve detailed the results and interpretations in the below sections, while my Python code as well as the steps I took to transform raw play-by-play data into a usable aggregated data set can be found on my Github page.
Expected Points on a Drive
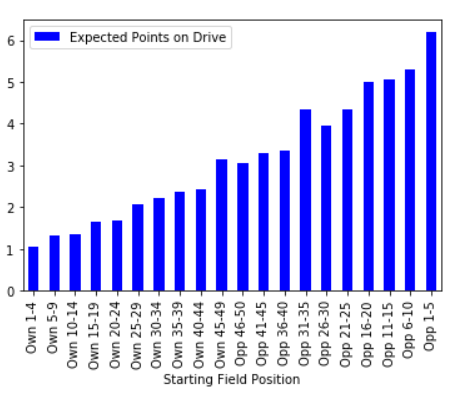
The expected points on a drive metric was the foundation of the analysis, providing us the value of starting field position. The expected point values can be interpreted as the league average of how many points get scored among all drives that began with the same field position. For example, if there were 100 drives that began between the offensive team’s 20-24-yard line for a total of 200 points scored (including defensive touchdowns as negative points), then the expected points for those drives is 2. Additionally, I removed drives from my data set that began with under 3 minutes left in the 1st half and under 5 minutes left in the game since those drives often have alternative intentions to scoring a touchdown (e.g. - running the clock out, kicking a half-ending field goal). Unsurprisingly, the expected point value trends upwards as the starting field position gets better, however also note that the variation of expected points slightly grows as field position gets better.
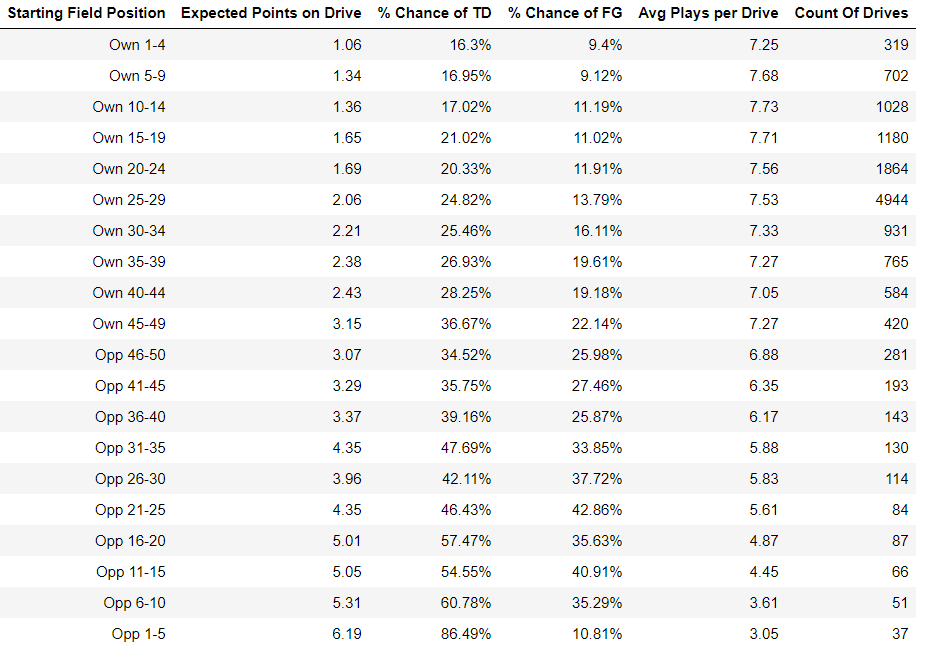
The table below provides further metrics on a basis of field position that bring additional value to the analysis. I found it interesting that the average plays per drive are relatively steady just until you get close to the opposing team’s end zone. Other notable takeaways are that the percent chance of a touchdown has an unsurprising upward trend with field position and drives starting between the opponents 21-25 have the highest chance of ending in a field goal.
4th Down Success Rates
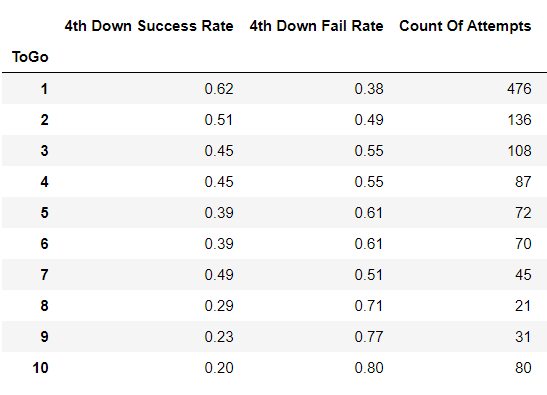
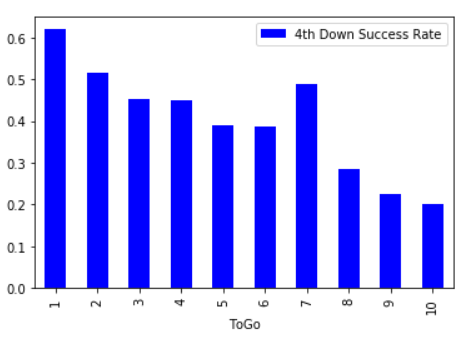
The next essential metric to make the 4th down decision is the average success rates based on how many yards are to go for a first down. As the distance to the first down gets greater, there are fewer attempts to look at, however enough to generally confirm that the success rates drop as distance grows. Intuitively, 4th and 10 has far more attempts than it’s neighboring distances due to the high quantity of drives that have 3 consecutive incomplete passes. 4th down plays with greater than 10 yards to go has an insignificant number of attempts so I chose to remove those from the equation.
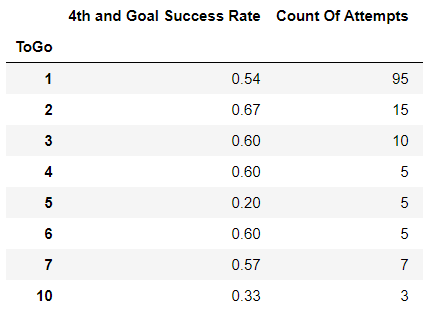
Separately, I calculated the 4th down conversion rates for 4th and goal-to-go plays. For plays of greater than 1 yard to the endzone, there are very few attempts for conclusive evidence, however we can still get a reasonable understanding of what happens in these situations. Since these plays deal with a 12th defender (the back of the end zone) and are generally higher-pressure situations, it’s predictable that the 4th down conversion rate in goal-to-go situations is lower than it is for other parts of the field.
Net Punt Distances
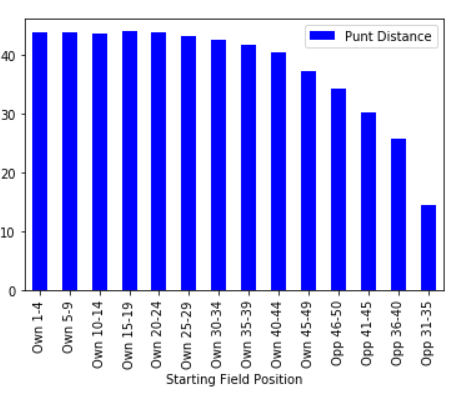
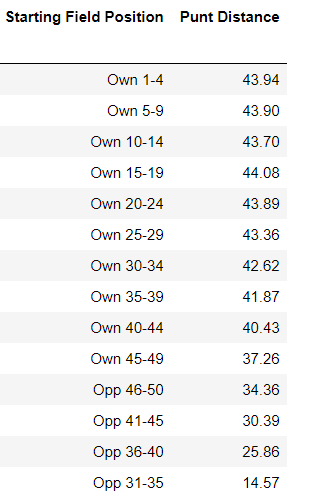
Another consideration to make when deciding whether to go for it is the expected yard line that the opposing team will begin their next drive. This includes the possibility of a return, a touchback, penalties, or a block. The chart and table below display the average net distances of punts, and that there’s a noticeable downward trend in net distance as punting team’s field position gets closer to the opposing team’s end zone. Punts on the opposing side of the field generally have a very low net distance, and we will later see how they provide very little field position value.
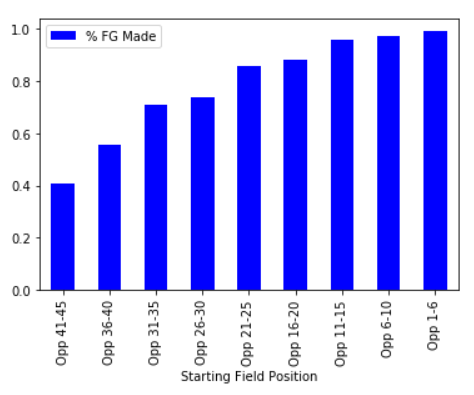
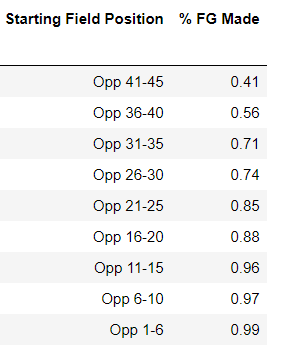
Field Goal Percentages
When within range, the 4th down conversation changes from ‘should we punt?’ to ‘should we kick the field goal?’ This requires us to take into consideration field goal averages when making this decision, and the below chart and table lay these out for us. The surprising result here is that 41% of field goals in the opponents 41-45-yard line range are successful. Likely the reason for this is that only elite kickers are given the opportunity to kick from that range and it would be much lower more teams attempted field goals from this distance.
Putting it all together
The final step of the analysis is to compile all the above information to make our decisions in each situation, as displayed on the chart on the front page. This step of the process has a heavy math focus and the below example will demonstrate how probability theory can be used to obtain the final conclusions. As mentioned in the introduction, these conclusions are generic and would need to be adjusted depending on the game situation. For example, teams with great defenses may be more inclined to punt with their ability to force a 3-and-out in order to get good field position back on their next possession. In other cases, you may just need a field goal based on the game situation or have a great quarter back and play drawn up that will give you a better chance to convert than the league average. Additionally, the weather and ability of your offensive line, kicker, or punter could play large factors that are not accounted for in this calculation.
Example: 4th and 3 on your own 42-yard line.
We will first record the important metrics for the calculation.
- 4th down conversion rate with 3 yards to go: 45%
- Expected points scored if converted (assuming 1st down will be in own 45 - 49 yard-line range: 3.15 points
- Expected points for opposing team if they start on their opponents 41-45-yard line: (incase the conversion fails) 3.29 points
- Expected Net Punt Distance (from 42-yard line): 40.43 yards
- Expected points for opposing team if punted (assuming start at 18-yard line with expected punt distance: 1.65 points
Next, we will walk through the possible decisions and their consequential outcomes:
- Go for it and convert: 45% of conversion success for 3.15 expected points if converted gives this outcome a value of 1.42 points
- Go for it and fail: 55% chance of fail for 3.29 expected points gives this outcome a value of 1.81 points for the opposing team
- Punt: The opposing team’s expected points is 1.65; your team expected points is 0 (drive over)
Here is what the expected point outcomes look like in a contingency table:
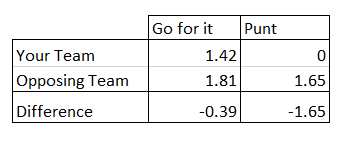
The decision to go for it gives your team a net difference in expected points of -0.39, while the decision to punt is -1.65. Therefor, simply by making the decision to punt, you are conceding an additional 1.26 net expected points. For punting to be the smarter decision, the net difference in going for it would have to be a larger negative than the net difference in punting.
Using the same logic, I went through all the combinations of game situations to make a unique conclusion that maximizes the offensive team’s expected outcome. If I found the difference in expected points for each decision was within a small deviation of each other or if I did not have enough observations to be convinced in the result, then I disregarded a definitive choice and labelled that situation ‘neutral’. For all others, I’ve confidently recorded my results and hope that NFL teams will adopt this data driven approach to 4th down decision making!