
With the NBA All-Star weekend now behind us, it’s a great time for basketball fans to reflect on the exciting 2021-22 season so far. Notably, several teams have thus far drastically improved in the standings compared to last season, including the Bulls, Heat, Grizzlies, Cavs, and Timberwolves. Success for some of these teams is partially due to increased player payrolls, however other teams are thriving with lower salaried rosters. The extent to which a team can compete on a low budget depends on many factors, including draft lottery luck, but this season’s All Star break standings might prove that budget can’t guarantee wins and losses.
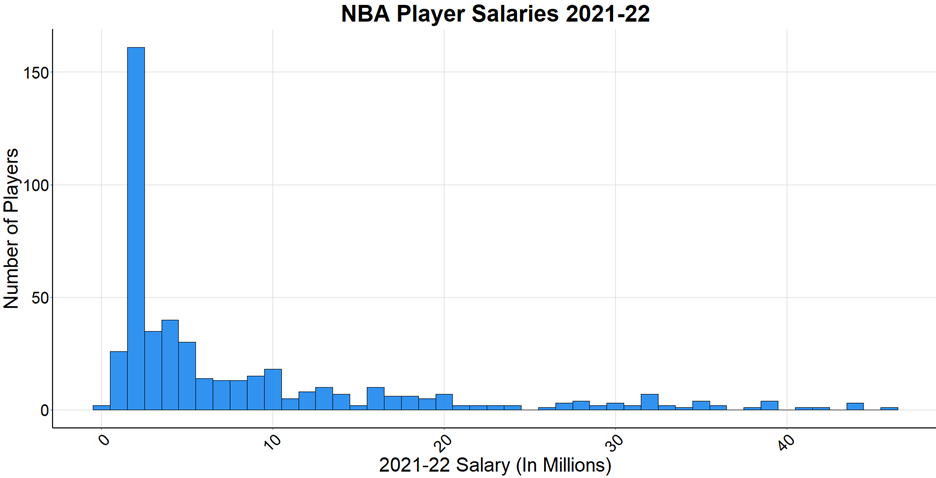
To set the stage, the chart below shows a distribution of NBA player salaries in the 2021-22 season. Most players in the league make between $1-$5 million and two-thirds of starters are making over $5 million, with a max salary just under $46 million held by Steph Curry. 55 players, an average of about 2 players per team, are making at least $20 million. With an NBA minimum at $558,000, just 16 players on a full season contract are making less than $1 million, one of which being the Bulls notable rookie, Ayo Dosunmo, at $925,258.
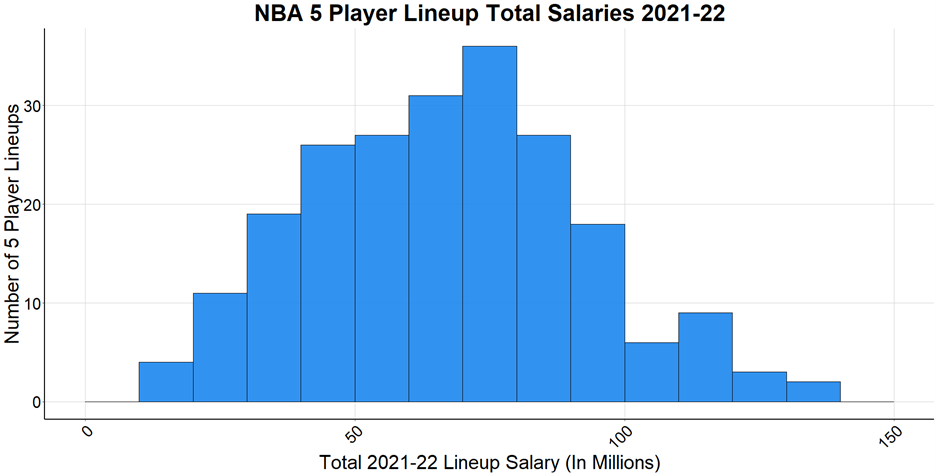
The next chart looks at the sum of salaries on the court at any given time for a 5-player lineup. 220 distinct 5-player lineups were analyzed, on the condition that the lineup has played together for at least 48 minutes of game time this season. For example, the two most common lineups that Bulls coach Billy Donovan has used this season are DeRozen, Vucevic, LaVine, Ball, Green at 152 minutes and DeRozen, Vucevic, LaVine, Green, Dosunmu at 127 minutes. In all, 10 unique combinations of 5 players have been on the court at the same time for the Bulls for at least 48 minutes so far this season. Generally, many NBA team’s 5-player lineups add up to somewhere between $50-$80 million in salary. At the extremes, the Warriors have routinely used the most expensive lineup worth about $125 million and 46 lineups with combined salaries less than that of Steph Curry’s $46 million have hit the 48-minute threshold as well.
In order to determine the connection between total salary and success, I’ve used the NBA advanced metric Net Rating as an objective measure. This value represents the net points (positive or negative) scored while a set of players are on the court together per 100 possessions. A team who wins a game by 5 points that featured 100 offensive and defensive possessions will have a Net Rating of +5. While there are other metrics that better predict future success and win/loss records, Net Rating serves as a simple and concrete description of ‘what happened?’ while a given lineup was out on the court. A notable flaw of the metric, however, is that is does not account for who the team is playing against. In a future analysis, I would potentially try alternative other evaluations of success.
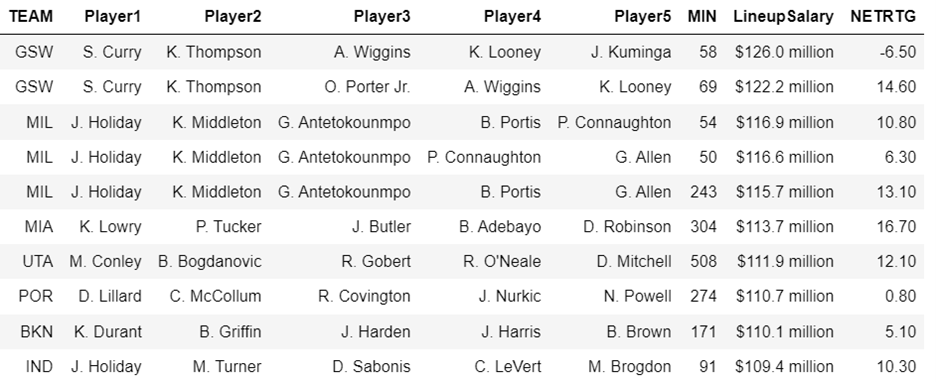
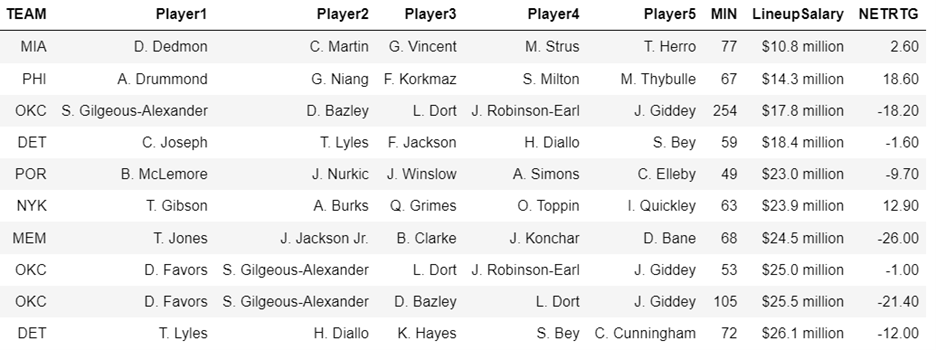
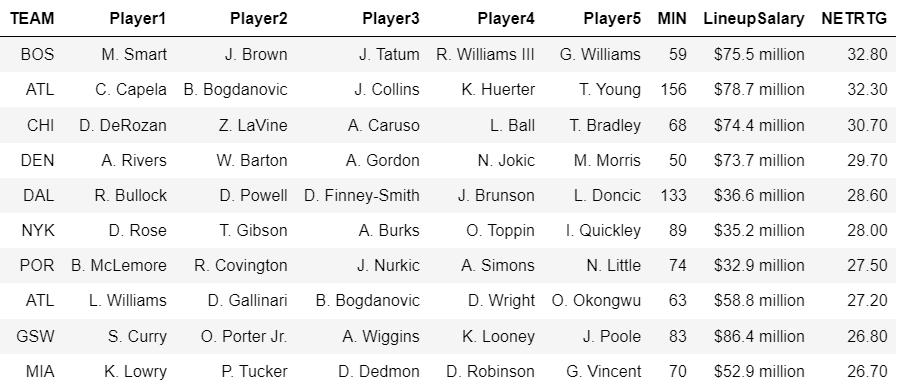
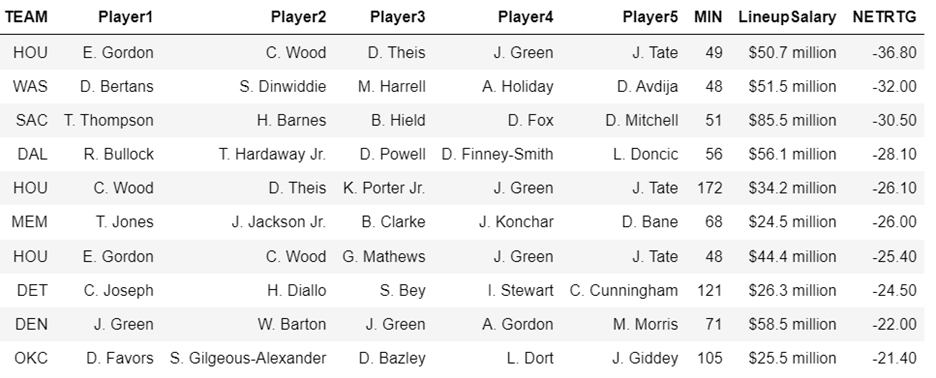
Before analyzing the Net Rating and Salary relationships in our data, we’ll first look at the top 10 highest and lowest salaried lineups thus far this season, among lineups that have played 48 minutes together. The Warriors and Bucks have played the most expensive lineups and are having great seasons, however the Warrior’s $126 million lineup of Curry, Thompson, Wiggins, Looney, and Kuminga is negative in their 58 minutes on the court. On the other hand, the 76ers have an incredibly inexpensive lineup that has played great together in their 67 minutes.
Top 10 Highest Paid 5-Player Lineups in 2021-22 Season
Top 10 Lowest Paid 5-Player Lineups in 2021-22 Season
The next two tables display the top 10 and bottom 10 lineups by Net Rating. With Luka Doncic on the final year of his rookie contract, the Mavericks have an extremely low salaried lineup as one of the best in the league. The Knicks, Trailblazers, and Heat additionally have inexpensive, yet successful lineups. Conversely, Sacramento has an above average priced lineup that is struggling in their 51 minutes together, but typically the low performing lineups with significant minutes together are also on the lower end of the salary spectrum.
Top 10 Highest Net Rating (NETRTG) 5-Player Lineups in 2021-22 Season First Half
Top 10 Lowest Net Rating (NETRTG) 5-Player Lineups in 2021-22 Season First Half
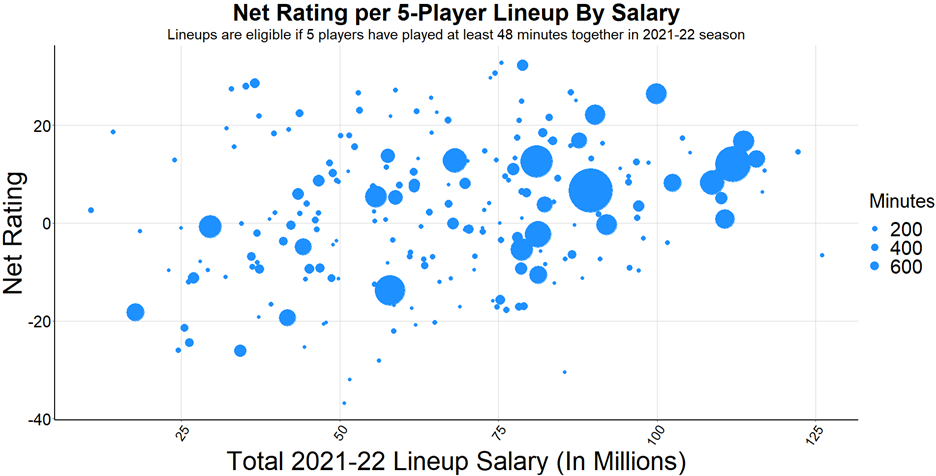
In the below chart, we can see a definitive uphill relationship between Net Rating and lineup salary among the most used lineups, although there seems to be little to no relationship between the two variables among more infrequently used lineups. In these cases, it is just as likely that an inexpensive lineup will succeed as will an expensive lineup. Perhaps the expensive lineups that are performing poorly are getting less minutes together throughout the season, while inexpensive lineups that are outperforming expectations are getting more minutes than otherwise expected.
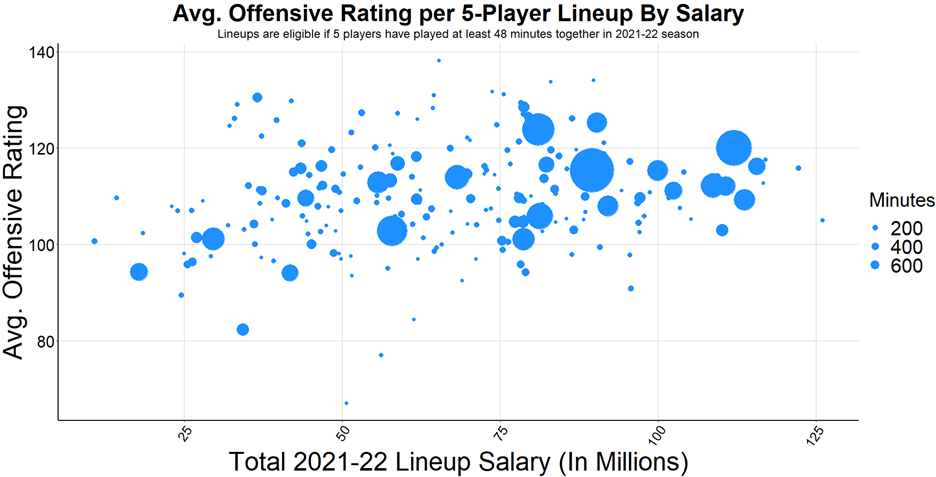
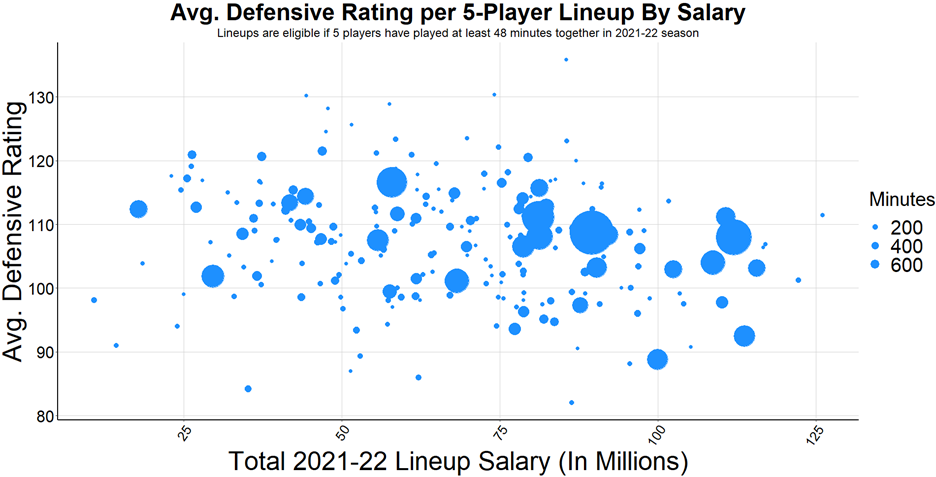
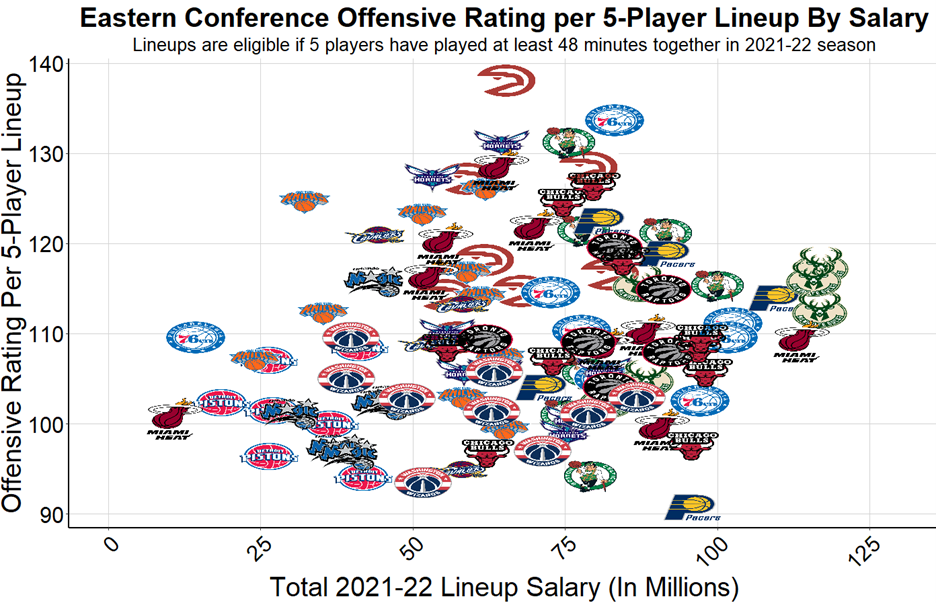
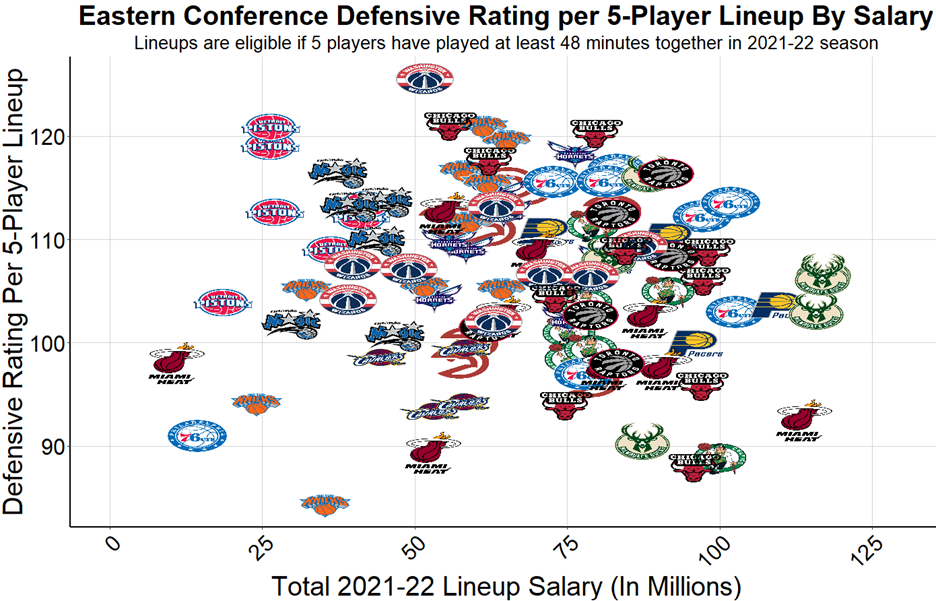
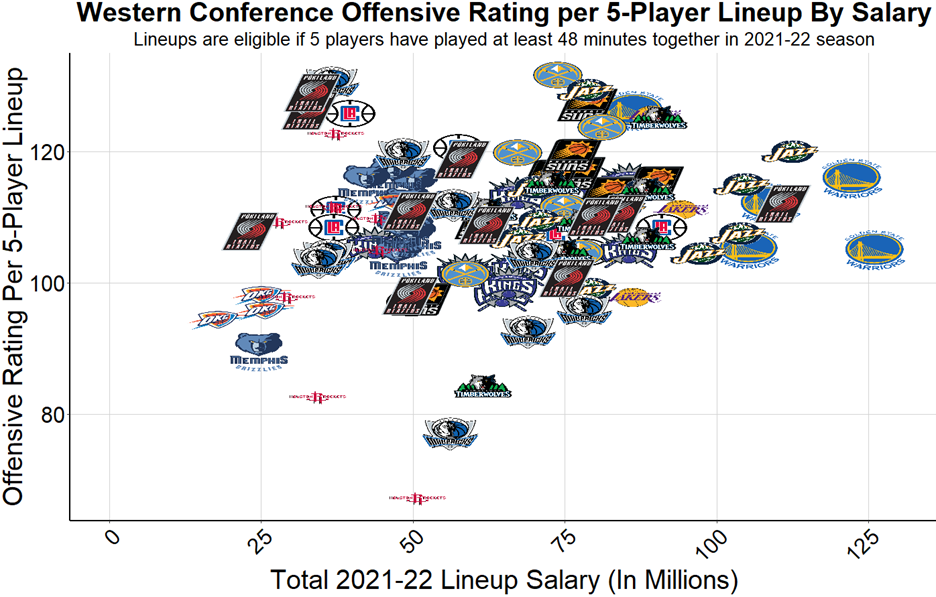
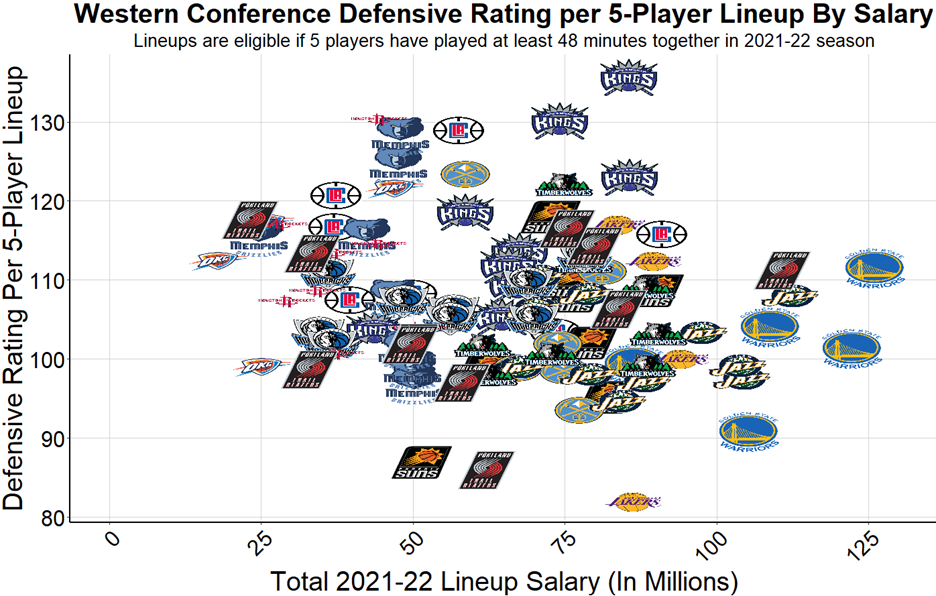
The next two charts break down Net Rating by offense and defense and tell an interesting story of their own. Just like the overall Net Rating, offensive ratings are well correlated with lineup salaries, especially among the most used lineups. We can also see that defensive ratings have virtually zero correlation with lineup salaries. There are just an many inexpensive, yet successful defensive lineups as there are expensive defensive lineups, inferring that NBA players get paid for their offensive abilities far more than their defensive abilities. As we’ll see later, the clever teams are very much aware of this notion and are taking advantage of it accordingly.
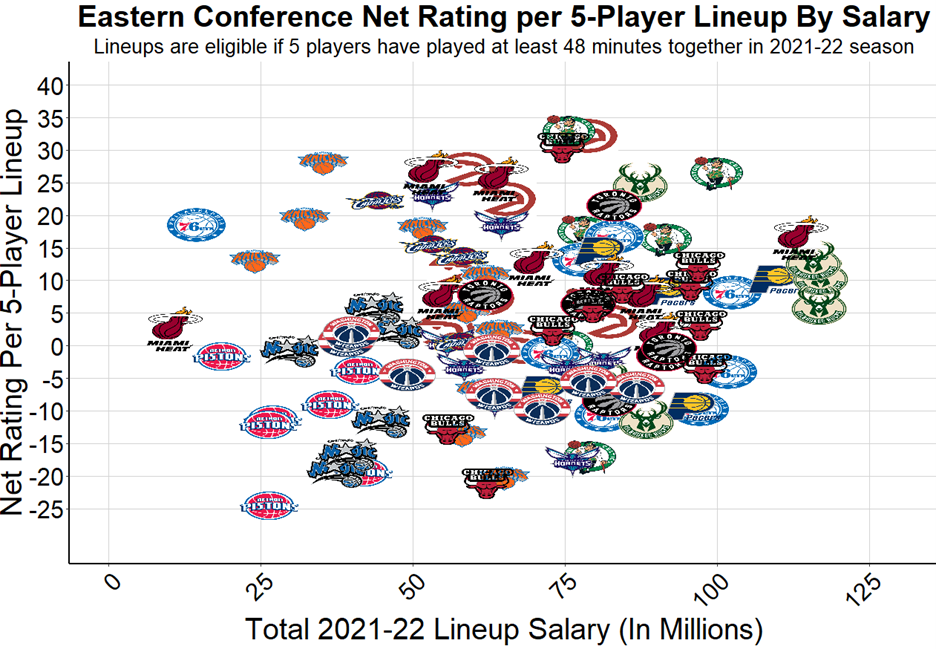
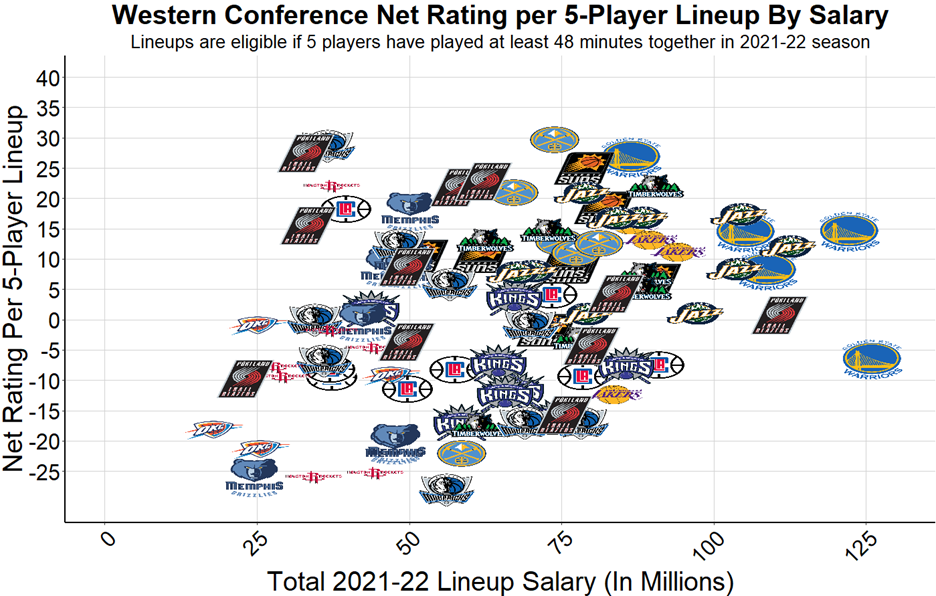
The next series of charts break down which teams each of the lineups represent for Net Ratings, Offensive Ratings, and Defensive Ratings. To avoid overcrowding, the charts have been split by Eastern Conference and Western Conference.
In the East, a glaring takeaway is that the Knicks have some very successful lineups at inexpensive costs, as Rose, Gibson, Burks, Toppin, and Quickly have produced a +29 rating in 89 minutes. Ironically their most expensive lineup with Burks, Fournier, Noel, Randle, and Barrett is sitting at a Net Rating of -20 from 63 minutes of court time. It’s possible, though, that the more expensive lineup is going up against more expensive and better opponent lineups, thus deflating their Net Rating. The Cavs and Hornets also show up well in the quadrant of low salaries and high Net Ratings; the latter can be attributed in large part to the star play of LaMello Ball, who sits on his rookie contract of just about $8 million. Conversely, the Pacers are considerably underperforming this season relative to the salaries of their lineups.
From the defensive chart, the Cavs are clearly the most successful low-budget team in the East. While their offense is solid but doesn’t necessarily stand out among the rest of the league, we can see that their strong defense likely holds a lot of weight towards their standing of being tied for 3rd in the conference. Additionally, while the Bulls aren’t in the low-budget category that the Cavs are in, and they are spending more this season than they did last season, they are also showing strong defensive numbers that out project expectations and have led to a successful first half.
In the Western Conference, the Warriors, Suns, Jazz, and Nuggets are all spending a ton of money, but are seeing positive results to show for it. The Grizzlies and Mavericks are successful teams playing off low salaries, both with breakout superstars on rookie contracts, Ja Morant and Luka Doncic. Contrarily, the Lakers are far underperforming expectations with their high payroll, and the Clippers and Trailblazers both have wide variance of successful and costly lineups that put them in all four quadrants.
As the prior 6 charts suggest, NBA success weighs not only on the amount of money a team spends, but the way in which they spend their money and manage their rosters in gameplay. Although it would be nearly impossible for a team resembling the Piston’s payroll to compete at the same level as a team resembling the Warrior’s payroll, roster development strategies certainly play a role in fluctuations between expected results and actual results. No team can be ruled out of playoff hopes simply based on their total salary spend, and it doesn’t take being in the top ranks of total payroll to consider yourself a championship contender, either.