
As the NBA trade deadline has recently passed, basketball fans from around the world have expressed mixed reactions to many of the moves (or moves that never were) made around the league. With the prevalence of analytics in professional sports, it’s reasonable to wonder whether decisions are mostly shaped as a result of data analysis or intuition. As outsiders, we’ll never truly know the specific indicators that lead to each decision, however my curiosity urged me to perform an analysis of my own to innovate the way that teams are comprised.
You don’t need analytics to convince yourself that if you want to win a championship in the NBA, your team needs an elite star. Where analytics can help, however, is to optimally assemble your roster around the one or two stars that your team pursues. We can use data to drive roster and lineup decisions based on the hypothesis that certain styles of play compliment each other better than others. In search for answers, I sifted through tens of thousands of 2016-17 and 2017-18 NBA in-game possessions to understand the on-court combination of player types that have the most success together.
As a prerequisite to the analysis, I defined and differentiated 7 unique player types by running a K-Means Clustering model on a set of advanced NBA statistics, in R. Inspired by Muthu Alagappan’s From 5 to 13, Redefining the Positions in Basketball, the purpose for creating clusters (as opposed to using the 5 commonly known basketball positions) was to specifically group players together who share a similar style of play regardless of their ambiguously labelled position. Below is a description of each of the 7 defined clusters as outputs of the algorithm, along with the traits and notable players that make up each cluster.
Cluster 1: Game-Managing Guards
Common traits: High percentage of team’s assists, slower pace of play than combo guards, lower percentage of points outside of paint
Notable players: Chris Paul, Russel Westbrook, Rajon Rondo, Kyle Lowry, Lonzo Ball, Ricky Rubio
Cluster 2: Combo Guards
Common traits: Scoring-minded guards, looks to score with shooting and driving, faster pace of play than game-managing guards
Notable players: Steph Curry, James Harden, Kemba Walker, Kyrie Irving
Cluster 3: Work-off-the-ball, Shooters
Common traits: Most shots are taken outside, high percentage of points are assisted, do not spend a lot of time with the ball in hand
Notable players: Klay Thompson, Kyle Korver, Doug McDermott
Cluster 4: Versatile Forwards
Common traits: Takes many shots, look to consistently score with shooting and driving, look to create their own shots rather than catch and shoot
Notable players: Lebron James, Kevin Durant, Jimmy Butler, Giannis Antetokounmpo
Cluster 5: Shooting Bigs
Common traits: Bigs who take many outside shots, offensive minded bigs
Notable players: Dirk Nowitzki, Kristaps Portzingis, Niko Mirotic
Cluster 6: Live-in-the-Post, Bigs
Common traits: Score most of their points in the paint, do not frequently take jumps shots, can be offensive and defensive minded
Notable players: Anthony Davis, Dwight Howard, LaMarcus Aldridge
Cluster7: Defensive-Focused Bigs
Common traits: Mostly are in the game for their defense, take relatively few shots
Notable players: Hassan Whiteside, Tristan Thompson, Zach Randolph
Now that we have clearly defined clusters, the next step I have taken is to analyze the success metrics of combinations of clusters while they are playing together. The NBA collects lineup data from 2-player lineups to 5-player lineups, which provides the complete stats that are taken while the specific combination of players are on the court at the same time. The below chart reflects data from the previous two completed seasons and can be interpreted as each value representing the average NETRTG when a player from the labelled cluster is on the court at the same time as a player from the titled cluster, regardless of the other 3 players. While not shown below, it’s also possible to break down ratings specifically by offense and defense.
NETRTG: Measures a team’s point differential per 100 possessions while the player is in the game
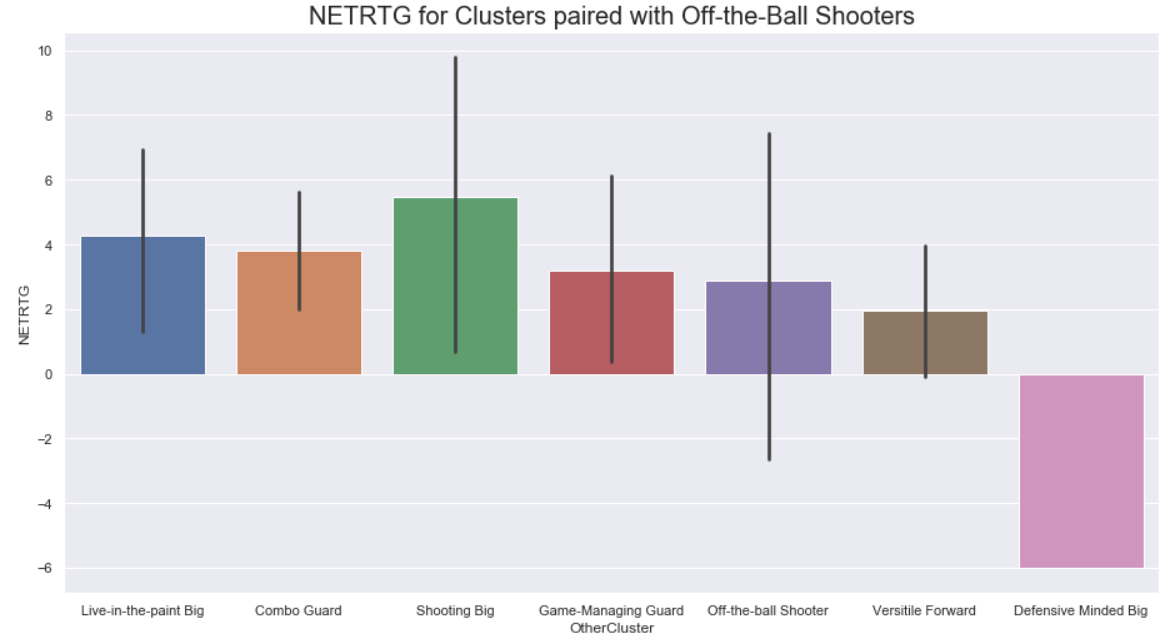
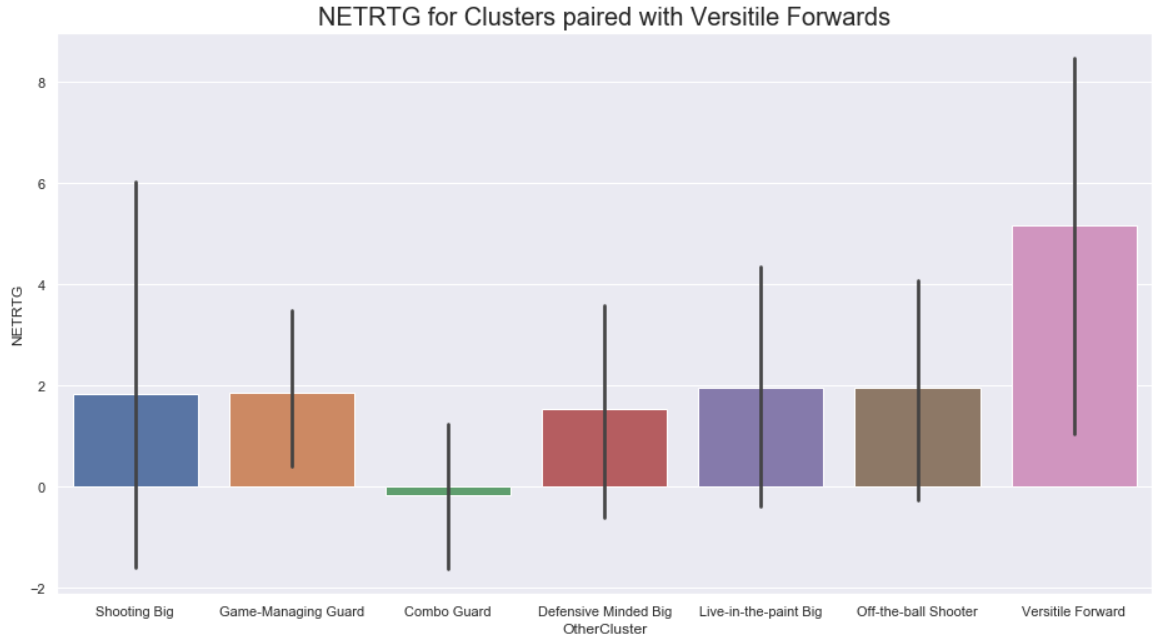
It’s interesting to see how NETRTG values change from cluster to cluster, however we must be aware of possible confounding variables; For example, if two versatile forwards are on the court together, it’s less likely that any of the other 3 players are also versatile forwards. Nonetheless, we recognize that pure shooting forwards have more success with combo guards than with game-managing guards, and versatile forwards have more success with game-managing guards than with combo guards, whatever the reasons may be.
It was compelling to zoom into single clusters to see how they pair with others, however the heat map below provides us a holistic view of cluster combo success. The axis numbers correspond to the clusters defined above and the data values represent the mean NETRTG for each combination of cluster.
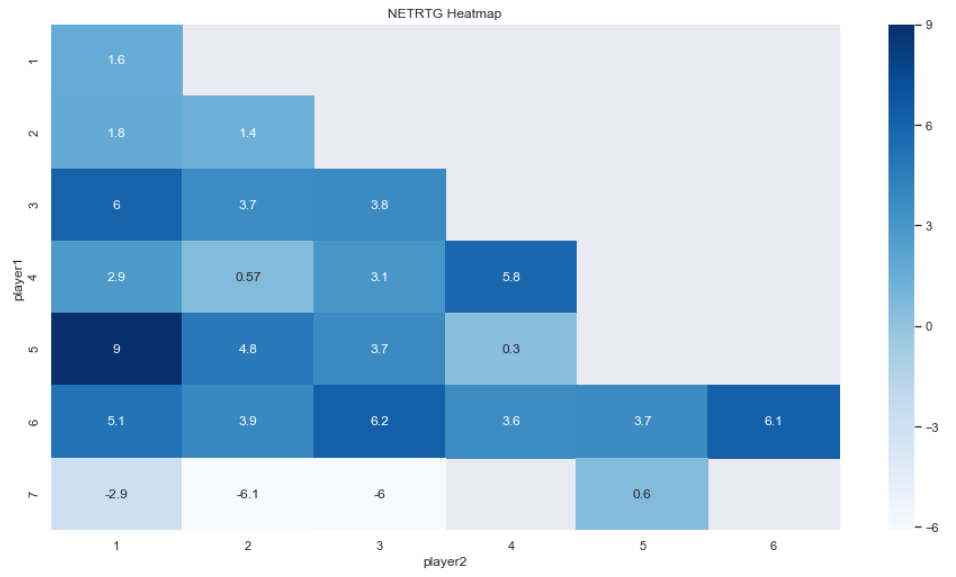
There’s a consensus in the basketball community that teams need to an elite star to consider themselves relevant. The above heatmap should serve as a guide to team front offices who are making crucial decisions about who else to sign, trade for, and put on the court. We can also run the same analysis on 3, 4, and 5-player cluster combos, although it would be difficult to visualize those dimensions of data. My advice doesn’t change the fact that teams should always go for the best available player within their price range, however this cluster analysis should certainly be used in cases of uncertainty.