Happy MLB Opening Day! You may be wondering what your team’s chances are of making the playoffs, but you’re not sure which website’s model to trust. I’ve created my own set of predictions using calculus and probability theory to derive the chance for each team to win their respective division. For the math crowd, I’ve detailed my process and formulas below the results.
The steps I used to reach my conclusions are summarized below:
- Averaged out the predicted 2019 win totals from several analytics websites and Vegas books
- Analyzed 9 previous seasons worth of win total predictions to understand the trends of means and variance of the residuals (How far off predictions were from actual win totals)
- Based on above steps, for each team I built a unique probability density function (PDF) for the expected wins for 2019
- Used calculus in Python to derive the probability that each team wins more games than the other 4 teams in their division
Step 1: Average out the 2019 predicted win totals from several analytics websites and Vegas books
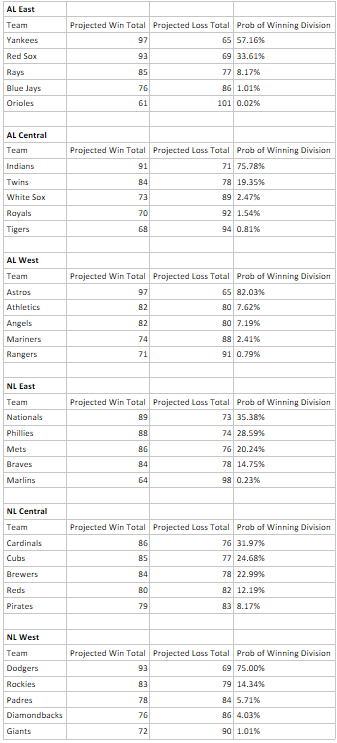
Many analytics websites have published the results from their respective models to predict the 2019 season outcome. While most models have similar results, it’s difficult to tell what went into each model and which models are likely to be the most accurate. Rather than picking just one or trying to develop my own model, I leveraged and averaged the results from several models as well as Vegas over/under totals as a starting point for my analysis. The averages are what is displayed in the above tables.
Step 2: Analyze previous seasons of win total predictions to understand the trends of means and variance of the residuals (How far off predictions were from actual win totals)
If I’m going to use these predictions in my analysis, I first need to understand historically how well these same types of models perform. Thankfully, Fangraphs, one of the website models I leveraged, has already published the results of a 9 year win total prediction analysis compared to actual outcomes. Relevant to what I’m trying to accomplish, here are a couple key takeaways:
- Teams with low win total predictions have a better chance of overperforming their prediction than teams with high win total predictions. The function for predicted wins vs. actual wins can be written as y = 0.81x + 14.97
- The variance of residuals for low win total predictions is wider than the variance for high win total predictions (teams with high win total predictions are more likely to have actual win totals closer to the predicted win totals)
- The residuals appear to be normally distributed To address the change in residual variance, I downloaded the prediction and actual win total data and calculated the standard deviation of the residuals for high win total predictions, medium win total predictions, and low win total predictions.
s_High = 6.262369
s_Med = 6.41859
s_Low = 7.30217
Step 3: Build a unique probability density function (PDF) for the expected wins for each team in 2019
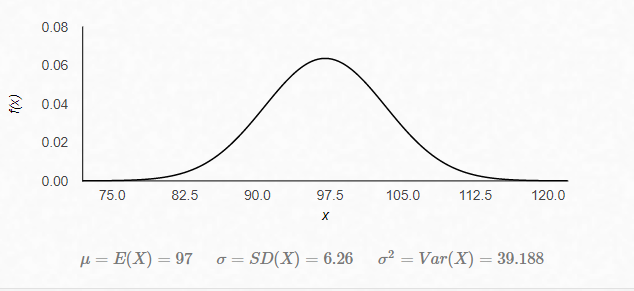
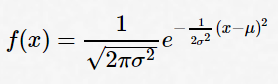
In probability theory, a probability density function (PDF) is a distribution that describes the probability of events occurring from a continuous random variable. By only knowing the mean and standard deviation, we can derive each PDF with calculus. We’ll use the Yankees as an example to demonstrate how this plays out: The Yankees are projected to win 97 games with a standard deviation of 6.26 games. We’ve previously concluded that the prediction distribution for their win total is very close to normally distributed, so we can draw the distribution in the bell curved fashion:
where:
The important takeaway from the above curve is that the values on the x axis are more likely under tall points in the curve and less likely under short parts of the curve. A nice feature of PDF’s is that by using standard probability theorems we can easily calculate the probability of the Yankees winning at least X games in 2019 or derive a prediction interval for the range of win totals that they are likely to finish between.
Step 4: Use calculus in Python to derive the probability that each team wins more games than the other 4 teams in their division
To predict the probability that each team wins their division, we need to calculate the probability that they finish with a better record than all the other teams in their division. (Disclaimer: I did not consider the possibility of ties and winning the division in game 163) The formula can be expressed as:
P(A wins) = P(A>B) * P(A>C) * P(A>D) * P(A>E)
where the 5 divisional teams are A, B, C, D and E
Thus, the challenge is to derive P(A>B), and the rest will follow suit.
To visualize this, let’s go back into context and use the Yankees and Rays as an example.
Mu_Yankees = 97, s_Yankees = 6.262369
Mu_Rays = 85, s_Rays = 6.41859
Their overlapping PDF’s would look like the graph below with the Rays in green and the Yankees in blue.
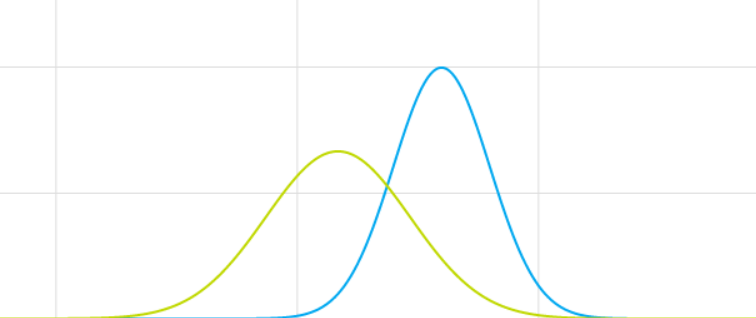
The probability that the Yankees finish with a greater win total than the Rays is equivalent to the probability that a random point chosen under the blue curve is greater than a random point chosen under the green curve. In order to do so, we will derive the below formula:
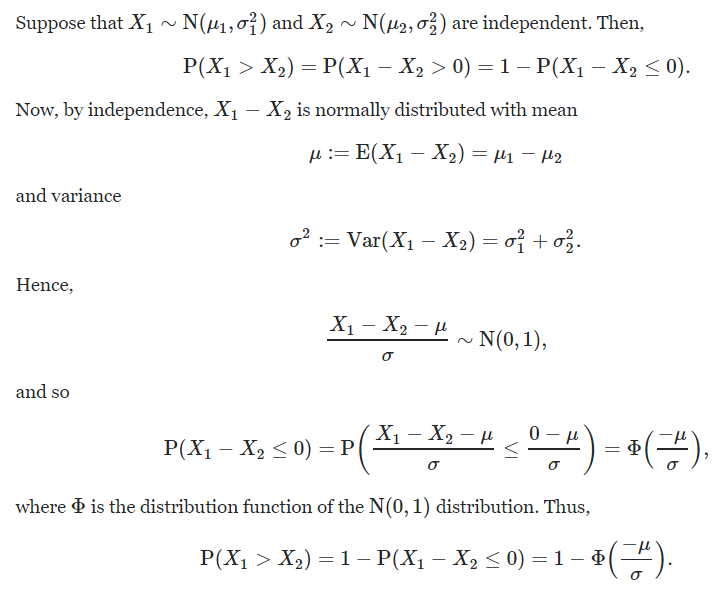
It’s technically improper that we assumed that the distributions are independent of each other. Afterall, the Yankees and Rays play each other 18 times per season. However, to account for the dependence of those games would only complicate the equation and likely not change our results much.
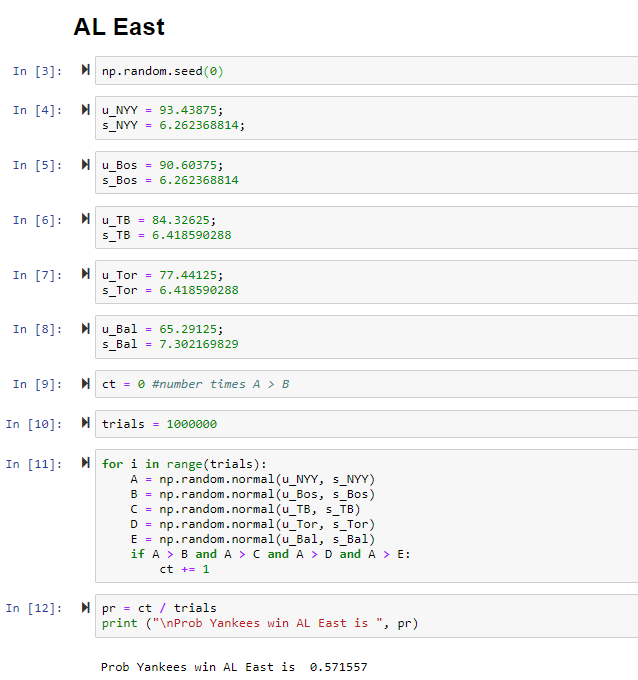
Now that we understand how to derive P(A>B), the final step was to write some Python code to make all these calculations for me and output the results. Below is a sample of my code for the AL East.