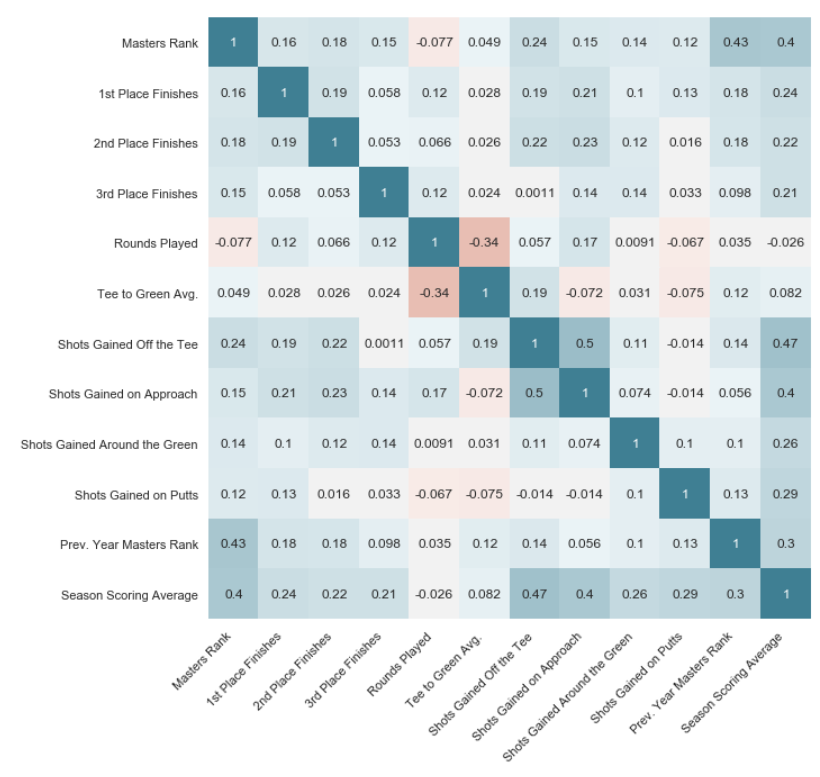
The 2021 Masters is underway this week and despite all the unpredictability of the tournament, golfer trends from the past several years will show which traits are most often correlated with success. The below table shows the correlation that several variables have with a player’s performance during Master’s Weekend. The data that feeds into this table goes back to 2015 to find golfer’s statistics between the start of each season and the tournament leading up to the Masters, as well as the rank in which the player finished in the respective Masters tournament.
Because of the erratic nature of the Masters, no variable is completely reliable but the number of top 10 finishes, the previous year’s Masters rank, the season scoring average, and shots gained off the tee have noteworthy significance. Meanwhile, shots gained on approach, around the green, and putting, have near zero correlation, because the separation of the best from the worst in these areas is less significant.
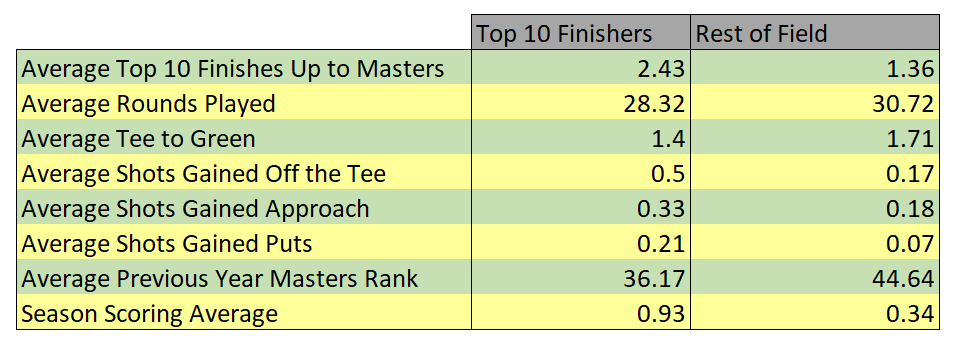
The next chart breaks down the average stats among those who finish in the top 10 in the Masters against the rest of the field. A similar conclusion can be drawn here as in the correlation matrix. The metrics with the greatest difference between top 10 finishers and the rest of the field imply greater predictability towards Master’s success.
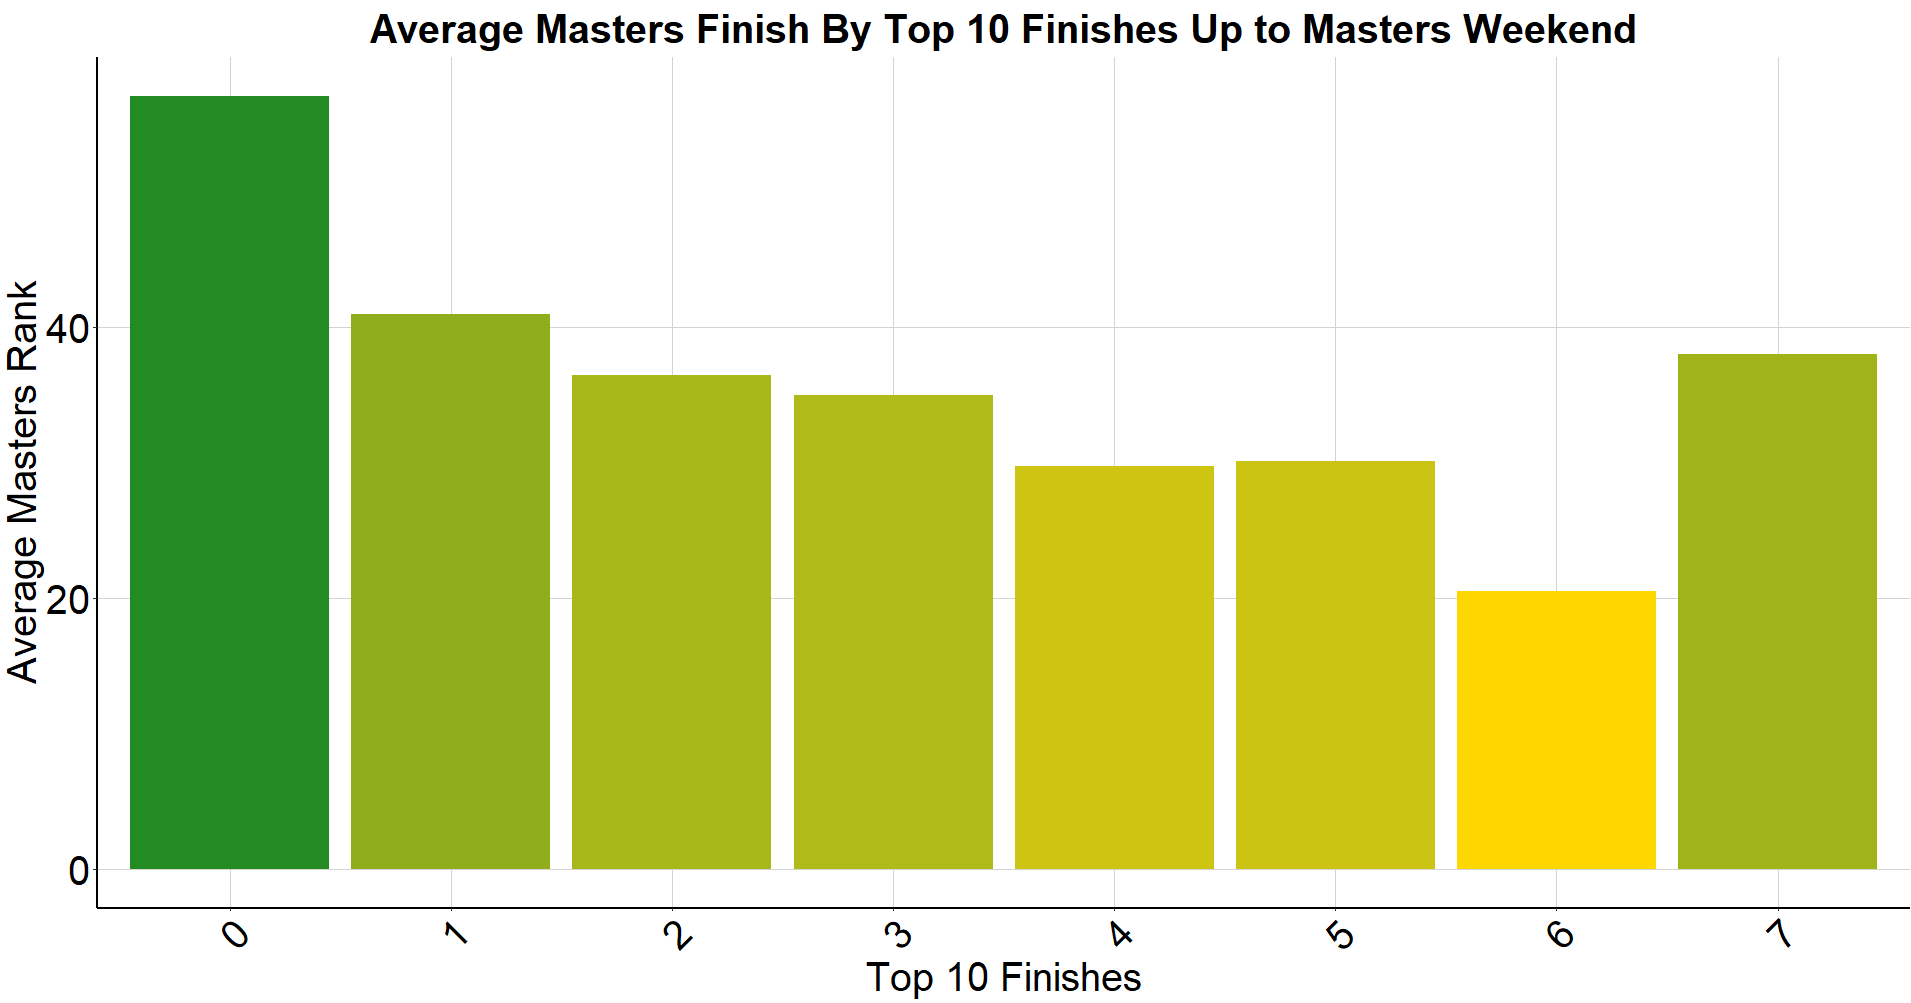
The next chart shows the average rank that a golfer finishes in the Master’s, broken down by the number of top 10 finishes they have leading up to the tournament. Unsurprisingly, the more top 10 finishes, the better the average rank despite the outlier at 7 top ten finishes. However, only half of the best golfers with 4-6 top 10 finishes will finish in the top 25 in the Masters.
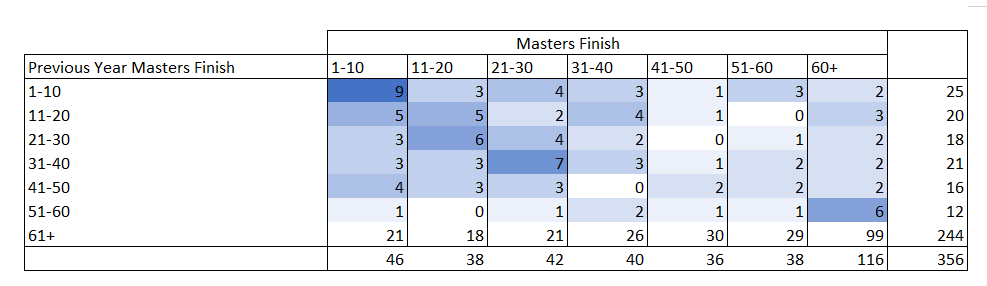
It’s often theorized that some golfer’s have the ability to bring about their best in the most intense circumstances, while others cannot pull themselves together regardless of how good they are. The below charts show the pattern of year over year Master’s rankings, indepentant of any other variable. The rows represent the number golfers who finished within the respective ranked bucket of 10 in a given year while the columns denote the number of golfers who finished within the respective ranked bucket of 10 in the following year. Hence, among the 25 golfers in the study who finished in the top 10 in a given year, 9 of them finished in the top 10 in the following year.
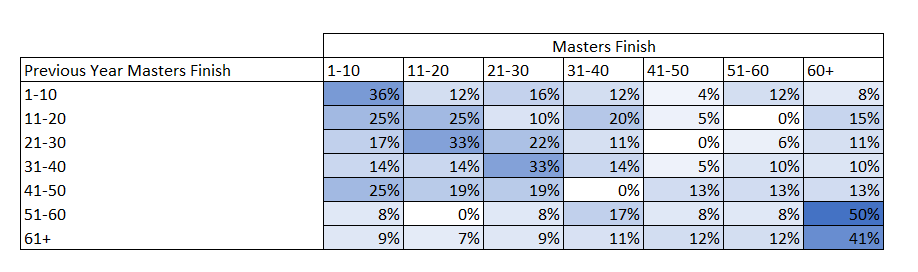
The same chart as above can be output as percentages, like in the table below. This table provides insight into an estimate of how many golfers from last tournament’s ranked bucket would be expected to fall into each ranked bucket for this year. As shown, 48% of previous year top 10 golfers finished in the top 10 in the following year, and 41% of golfers who finished 60+ finished60+ again the following year.
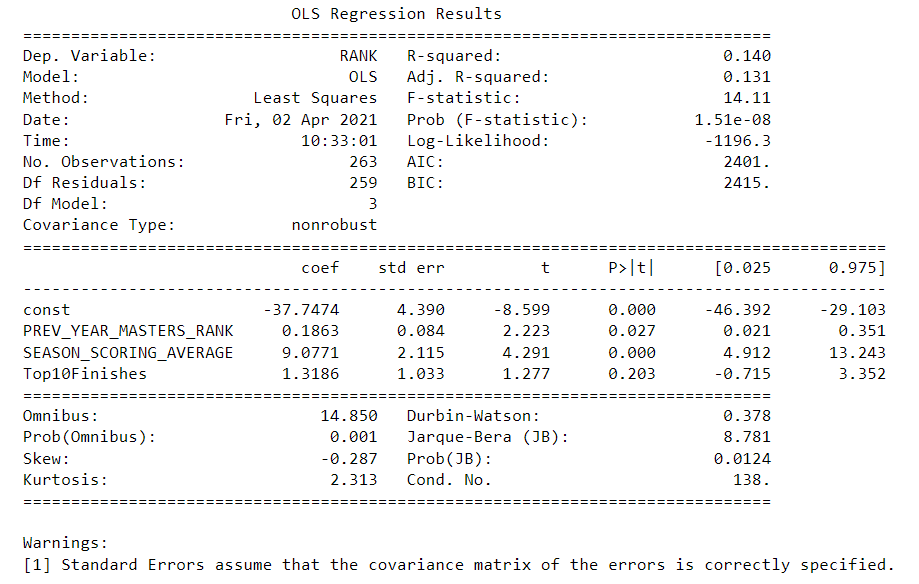
Finally, it’s important to make clear just how unpredicatable the Masters really is, in statistical terms. The below output is the result of running a Least-Squares Regression Model, using just the most correlated variables to predict a golfer’s Master’s rank. While there are a lot of metrics in this output, the important one to note is the R-squared at 0.140. This means that just 14% of the variance in the model can be attributed to (predicted by) the variables in the model. The other 86% of the model’s variance is just randomness. As seen in recent years, crazy things happen in the Master’s that nobody (and no statistical model) can possibly predict. However, if you’re looking for some slight edge in predicting your Master’s pool, the above tables would be the best thing to use.